3 Pillars That Make Open Source LLM Observability Work for Engineers

For production LLM apps, adopt a self-hostable observability stack that combines span-level tracing, automated evaluation through LLM-as-a-judge, and prompt management with version control. Open source LLM observability built on these three pillars catches quality regressions before users do. An open-source option built on this exact model is available, and OpenTelemetry gives you the standards-based instrumentation layer to connect it to whatever you already run.
TL;DR:
- Most teams fail to connect observability metrics directly to quality evaluation, risking blind spots in hallucination and factual accuracy.
- Focus on capturing granular trace data, including retrieval, tool calls, and multi-turn conversations, for effective debugging and analysis.
- Automated evaluation pipelines with LLM-as-a-judge are essential to scale quality checks versus manual review bottlenecks.
- Using standards like OpenTelemetry ensures trace portability across different backends, preventing vendor lock-in.
- Prioritize testing observability UI during simulated incidents to ensure quick identification of issues under real conditions.
Table of Contents
- What Is LLM Observability, and Why Does It Matter for Production Apps?
- Key Features to Look for in an Open Source LLM Observability Stack
- How to Instrument an LLM Application: A Practical Implementation Checklist
- How MLflow Approaches LLM Observability
- Best Practices for Observability-Driven LLM Development
- What Actually Separates Teams That Succeed With Open Source Observability
- Get Started With MLflow for Open Source LLM Observability
What Is LLM Observability, and Why Does It Matter for Production Apps?
Traditional application performance monitoring (APM) tracks whether a service is up, how fast it responds, and where it throws errors. That tells you almost nothing about whether your LLM app is actually working. A chatbot can return a 200 status code in 400 milliseconds, and still hallucinate a refund policy that doesn't exist. LLM observability exists to catch that gap between "the system ran" and "the system was right."
The vocabulary here matters because it maps to how you'll structure your data. A trace is the full record of one request through your system, from the initial prompt to the final response. A span is one step inside that trace, such as a retrieval call, a tool invocation, or a single model completion. Group related traces into sessions when you're tracking a multi-turn conversation, and build evaluation datasets from real production traffic so your quality checks reflect what users actually ask.
Four signal categories dominate any serious LLM monitoring setup:
- Cost: token spend per request, per feature, and per user segment.
- Latency: time to first token and total completion time, especially for streaming responses.
- Token usage: input/output ratios that reveal prompt bloat or inefficient context windows.
- Quality and hallucination rate: how often outputs drift from grounded, factual, or policy-compliant answers.
Standards-based instrumentation matters more than it sounds. Building a proprietary tracing format locks you into one vendor's dashboards forever. OpenTelemetry gives LLM apps the same portability that traditional infrastructure monitoring has had for years, letting you route trace data anywhere without re-instrumenting your code every time you change backends.
Key Features to Look for in an Open Source LLM Observability Stack
Not every open source model tracking project covers the same ground. Before you commit engineering time to any stack, run it against this checklist.
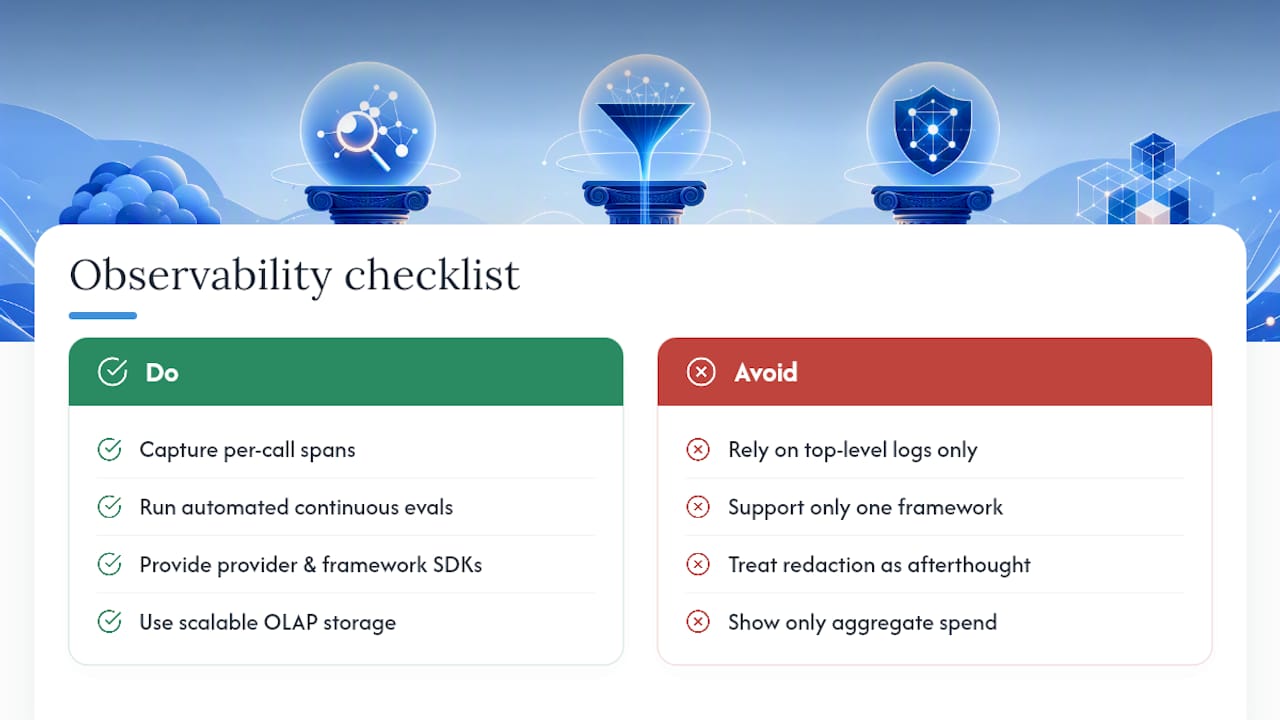
Tracing granularity. You need per-call spans, not just top-level request logs. That means capturing retrieval spans (what did the vector database actually return), tool-call spans (which function did the agent invoke and with what arguments), and session-level grouping so you can replay an entire multi-turn conversation instead of staring at disconnected fragments.
Automated evaluation pipelines. Manual review doesn't scale past a demo. Look for built-in support for LLM-as-a-judge, where a separate model scores outputs against a rubric for factuality, tone, or task completion. The strongest projects let you run these evals continuously against production samples, not just at release time, turning evaluation into a quality gate rather than a postmortem tool.
Provider and framework integrations. Confirm SDK coverage for the frameworks you actually use, whether that's LangChain, a custom agent loop, or direct API calls to a model provider. A tool that only supports one framework becomes dead weight the moment your architecture changes.
Storage and scale architecture. Trace volume grows fast, and a chatty agent can generate dozens of spans per user turn. Many open-source observability projects lean on OLAP-style backends like ClickHouse to handle high-throughput ingestion while keeping analytical queries fast. Confirm the project's storage layer can survive your actual traffic, not just a demo dataset.
Security and redaction. Prompts and outputs routinely contain names, emails, account numbers, and other data you don't want sitting in plaintext logs. Redaction and PII scanning should be a first-class feature, not an afterthought you bolt on later. Several open-source projects build string redaction and telemetry opt-out directly into their logging layer, which is the right place for it.
Cost observability. Token accounting needs to break down by model, endpoint, and business unit, not just show a single aggregate spend number. Without that granularity, you can't tell whether a cost spike came from a runaway retry loop or a genuinely higher-traffic day.
Developer ergonomics. A trace viewer that takes five clicks to find a failed span will get ignored during an incident. Look for a UI that supports fast filtering, side-by-side prompt comparison, and a playground where you can replay a captured trace with a modified prompt.
Pro Tip: Test any observability tool's UI during a simulated incident, not during a calm demo. Load fifty traces, inject a deliberately bad one, and time how long it takes you to find it. That number tells you more than any feature list.
How to Instrument an LLM Application: A Practical Implementation Checklist
Instrumentation projects stall when teams try to capture everything on day one. Work through this in order instead.
-
Decide what to capture first. At minimum: the span structure (call boundaries), the exact prompt sent to the model, model parameters (temperature, max tokens, model version), retrieval context if you use RAG, and any human or automated annotations added after the fact. Skipping model parameters is the single most common gap teams regret, because you can't debug a regression if you don't know which model version produced it.
-
Choose your ingestion path. You have three realistic options: a vendor SDK embedded directly in your code, an OpenTelemetry adapter that instruments model calls and vector database activity automatically, or a gateway proxy that sits between your app and the model provider. The OpenTelemetry path is worth defaulting to if you already run Datadog, Honeycomb, or a similar backend, since it exports standard trace data your existing dashboards can already read.
-
Set storage and retention rules. Keep hot, full-fidelity traces for a shorter window (a week or two is common) and roll aggregated metrics into longer-term storage. Sampling matters here: capture 100% of error traces and a statistically meaningful sample of successful ones, rather than trying to keep everything forever at full detail.
-
Automate evaluation and wire it into CI. Curate a dataset of representative prompts, define your LLM-as-a-judge rubric, and run it against every pull request that touches prompt templates or model configuration. This is what separates observability-driven development from occasional manual spot-checks.
-
Set SLOs and alerts. Define acceptable thresholds for latency (say, time-to-first-token under a target you've validated with users) and quality (hallucination rate under a threshold measured by your eval suite). Alert on both. Test every alert path in staging before you trust it in production.
-
Run through a privacy checklist. Confirm redaction rules for PII before any prompt data hits persistent storage, lock down access controls to trace data by role, and give users or internal teams a documented telemetry opt-out where your data governance policy requires one.
A pattern worth calling out explicitly: for agentic workflows, capture both the agent's step metadata (tool calls, the action chosen) and the underlying LLM span together. Reconstructing a reasoning chain after the fact is nearly impossible if you only logged the final output and none of the intermediate decisions.
How MLflow Approaches LLM Observability
Some platforms are built around the same three pillars this checklist walks through: tracing, evaluation, and prompt governance, applied specifically to agentic and GenAI workloads rather than bolted onto a generic ML monitoring tool.
Deep tracing of agentic reasoning is the core piece. MLflow captures each step an agent takes, including tool calls and intermediate decisions, alongside the LLM spans themselves, which directly satisfies the "capture agent metadata plus the LLM span together" pattern that makes agent debugging tractable instead of guesswork.
For evaluation, MLflow's LLM-as-a-Judge framework automates the scoring step that used to require a human reviewer reading through transcripts one at a time. You define the rubric, point it at a dataset, and get consistent scoring you can track release over release. A deeper technical walkthrough of how the judge model evaluates outputs is worth reading if you're designing your own rubric from scratch.
On the governance side, centralized AI Gateways handle prompt management and versioning across providers, so switching a model or rolling back a prompt template doesn't mean hunting through scattered config files. That maps directly to the "choose your ingestion path" and "prompt version control" checklist items above.
- Tracing: agentic reasoning traces plus standard LLM spans, unified in one system.
- Evaluation: automated LLM-as-a-Judge pipelines you can run in CI.
- Governance: AI Gateway for cross-provider prompt management and versioning.
- Deployment: self-hosted by default, with enterprise support options for teams that need bespoke integration or compliance guarantees.
Pro Tip: If you're migrating from ad hoc logging to structured observability, start by instrumenting just your highest-traffic endpoint with MLflow's tracing before rolling it out everywhere. You'll catch integration issues on one code path instead of ten.
Teams that need more than the self-hosted core can browse practical implementation guides covering SDK integration and deployment patterns in more depth than any single article can cover.
Best Practices for Observability-Driven LLM Development
The teams that get real value from open source AI observability tend to run the same loop repeatedly: capture, evaluate, label, experiment, release. Skipping any single step in that cadence is usually where quality problems sneak back in.
Capture every production request by default, then evaluate a sample continuously rather than only after a user complains. Label the outputs your eval flags as questionable, feeding a growing dataset of edge cases back into your test suite. Experiment against that dataset before you ship a prompt change, and only then release, watching your quality dashboards closely for the first few hours.
Signal prioritization matters just as much as the cadence. Quality alerts (hallucination rate crossing a threshold, context loss in long conversations) should page someone faster than a pure latency blip, because a slow answer frustrates one user while a wrong answer can damage trust at scale. Infrastructure alerts, like queue depth or provider rate limits, belong on a slower, batched notification channel unless they're severe enough to cause outright failures.
Retention and sampling decisions come down to a straightforward tradeoff:
| Approach | Fidelity | Cost | Best for |
|---|---|---|---|
| Full trace retention, no sampling | Highest | Highest | Low-traffic apps, early-stage debugging |
| 100% error capture, sampled success | High for failures | Moderate | Most production apps past initial launch |
| Aggregated metrics only, short-lived traces | Lowest | Lowest | High-volume apps with mature eval pipelines |
Team process closes the loop. Annotation work needs a clear owner, whether that's a rotating on-call engineer or a dedicated quality reviewer, and incident response for a quality regression should follow the same discipline as an infrastructure outage: a named owner, a documented root cause, and a dataset update so the same failure gets caught automatically next time.
What Actually Separates Teams That Succeed With Open Source Observability
Most teams get the tracing part right on the first try and the evaluation part wrong. It's the easier half technically, so it gets built first, and then teams stop, satisfied they can now "see" what their LLM is doing. Seeing isn't the same as judging. A trace viewer full of colorful spans feels like progress, but if nothing is scoring those traces against a rubric, you've built a very expensive log viewer.
The self-hosted versus hybrid question comes up constantly, and the honest answer depends on your compliance posture more than your engineering preference. Full self-hosting gives you complete control over where prompt data lives, which matters enormously if you're handling regulated data or operating under contractual data residency requirements. A hybrid approach, where you self-host tracing but lean on a managed eval service, can get you moving faster, but it means sending production prompts to a third party. Read your data governance policy before you pick, not after.
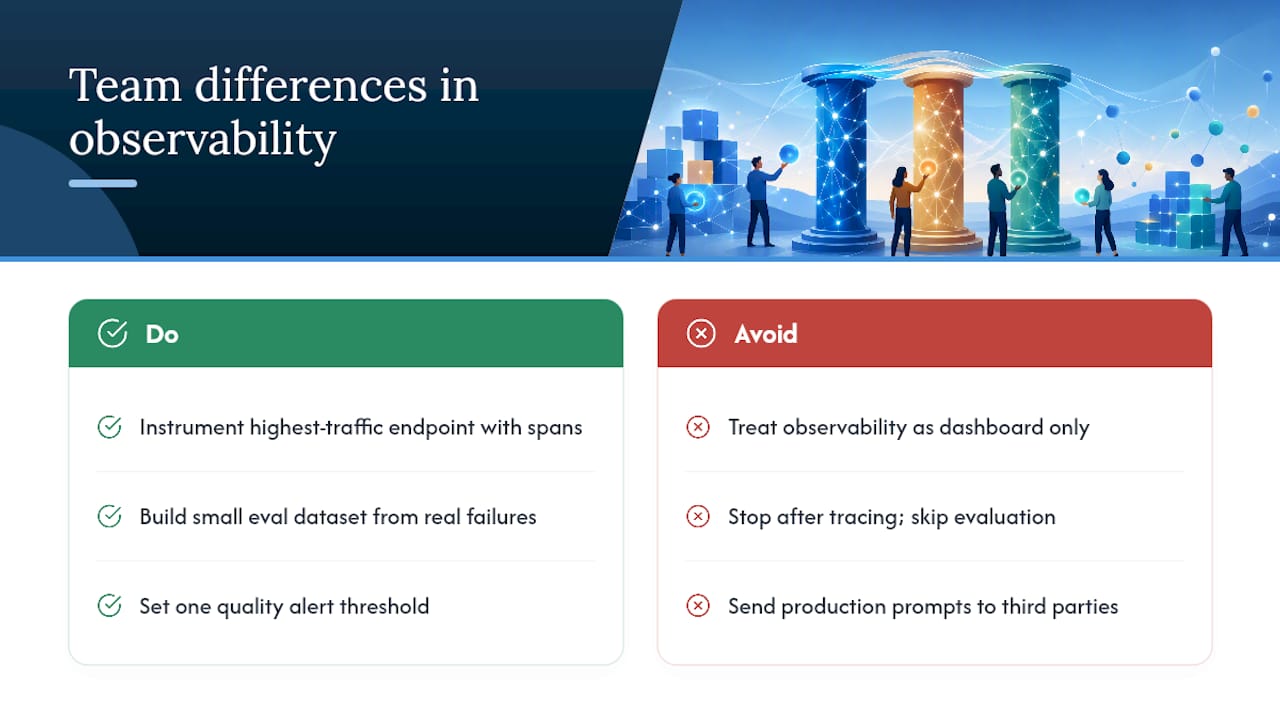
The biggest overlooked pitfall isn't technical at all. It's treating observability as a monitoring dashboard instead of a development practice. The teams that actually improve their models over time run evaluation as part of their pull request process, the same way they'd run unit tests. The teams that struggle bolt observability on after an incident, look at it for a week, then forget it exists until the next fire.
Three things worth doing this week: instrument your single highest-traffic endpoint with span-level tracing if you haven't already, build one small evaluation dataset from real production failures instead of synthetic examples, and set one quality alert threshold even if it's a rough guess. A rough alert beats no alert.
— Kevin
Get Started With MLflow for Open Source LLM Observability
MLflow gives you a working implementation of everything covered above, not a partial toolkit you have to stitch together with three other projects. Tracing, automated evaluation, and prompt governance live in one open-source platform instead of scattered across a homegrown logging layer, a separate eval script, and a spreadsheet tracking prompt versions.

The AI Observability product page walks through the tracing and monitoring features directly, and the Agent & LLM Engineering platform covers how observability connects to orchestration and deployment for teams running production agents. Both are self-hostable from day one, with enterprise support available for teams that need compliance guarantees or bespoke integration work beyond what the open-source core covers.
If you're evaluating tools this quarter, the fastest path is to instrument one endpoint and run your first automated evaluation before committing further engineering time. Start with the observability overview and see how quickly you can get a real trace into the system.