MLflow for Engineers: Trace LLM Requests and Link Cost to Eval

LLM request tracing is the practice of recording a structured, queryable record of every call your application makes to a model, including prompts, tokens, latency, tool calls, and metadata, organized into traces and spans. It's how you debug a bad response, attribute cost to a feature, and catch quality regressions before customers do. The single most important thing to do first: instrument one endpoint with a wrapper or an OTLP exporter and confirm traces are landing somewhere you can query them.
TL;DR:
- Instrumenting a single high-traffic endpoint with SDK wrappers or OTLP is enough to start capturing useful traces before expanding to full coverage.
- Choosing a trace schema with core fields like request ID, prompt, model, token counts, and latency ensures meaningful data collection and easier troubleshooting.
- Sampling policies and PII redaction are essential to control storage costs and protect sensitive information in large-scale tracing.
- Linking evaluation scores directly to traces enables automatic detection of regressions and quality issues tied to specific prompts and model versions.
- Using MLflow's integrated observability tools simplifies setup, consolidates tracing with evaluation, and accelerates getting actionable insights in production environments.
Table of Contents
- What an LLM Trace Actually Records (and Why It Beats Plaintext Logs)
- Choosing How to Capture Traces: SDK Wrappers, OTLP, or HTTP Interception
- A Five-Step Playbook to Start Tracing This Week
- What Traces Actually Solve Once They're Running
- Sampling, PII, and the Performance Cost Nobody Mentions
- Why Trace-Linked Evaluation Changes the Debugging Equation
- Getting Started With MLflow's Tracing and Evaluation Tools
What an LLM Trace Actually Records (and Why It Beats Plaintext Logs)
A trace represents one full request lifecycle, from the moment a user's input hits your application to the moment a response returns. Inside that trace, each discrete operation, a model call, a retrieval lookup, a tool invocation, gets its own span. Each span can carry one or more observations: the raw inputs, outputs, and scores tied to that specific step. When an agent runs across multiple turns, a session ID ties the individual traces together so you can reconstruct the whole conversation, not just one exchange, according to the llmflow project's documentation on session correlation.
The fields worth capturing on every span:
- Request ID and timestamp, for correlation and ordering
- Full prompt (system, user, and any injected context)
- Model name and parameters (temperature, max tokens, top_p)
- Token counts, split by input and output
- Latency, measured per span and for the total trace
- Finish reason (stop, length, tool call, error)
- Tool calls and retrieval hits, with their own inputs and outputs
- Status code and any error payload
Plaintext logs bury this in unstructured strings you have to grep. A trace schema lets you filter by model, sort by latency percentile, or pull every request where token count exceeded a threshold, in a single query instead of a text search across log files.
Choosing How to Capture Traces: SDK Wrappers, OTLP, or HTTP Interception
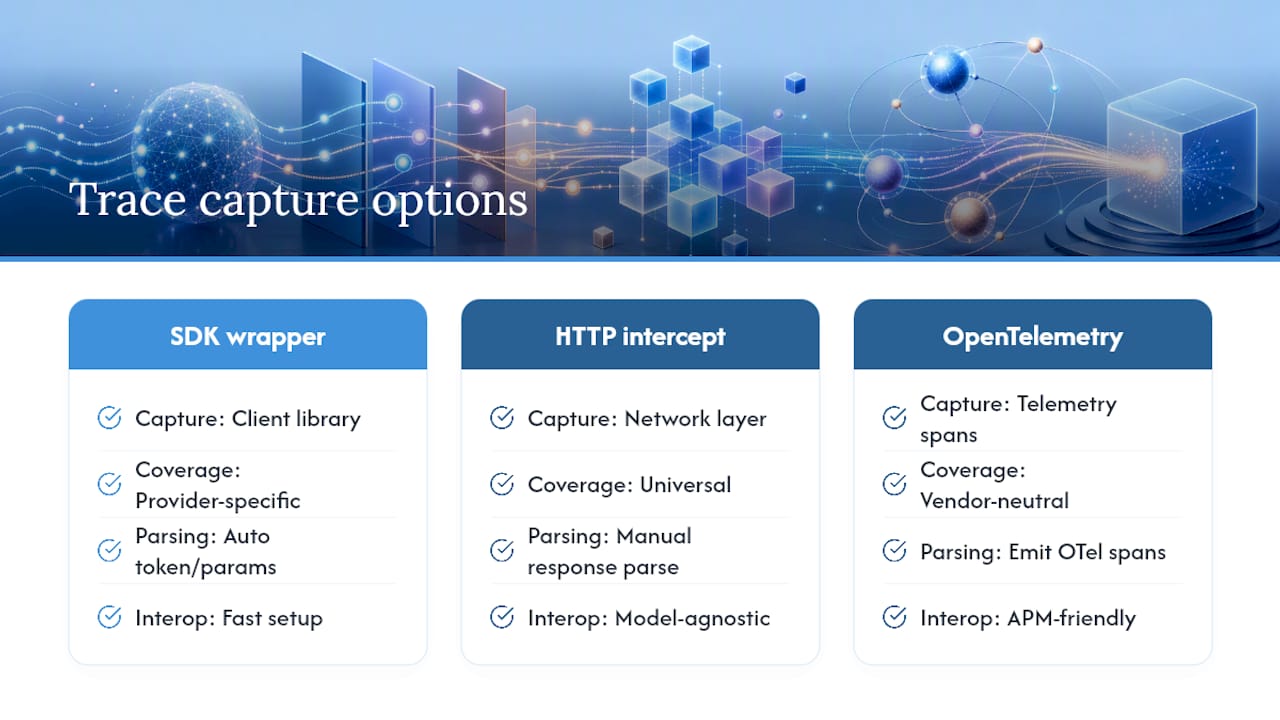
Three instrumentation paths dominate, and each fits a different stage of maturity. SDK wrappers hook directly into the provider client library (OpenAI, Anthropic, and similar), automatically capturing token counts and parameters with almost no code change. This is the fastest way to get useful data, but it only works where a wrapper exists for that provider.
HTTP interception sits at the network layer instead, capturing any outbound request regardless of provider or SDK version. It is more universal but requires you to parse response bodies yourself, since it has no awareness of the model's internal parameter names.
OpenTelemetry (OTLP) is the vendor-neutral option. You emit spans in the OTel format and forward them to any collector or backend that speaks the protocol. This is the path to pick if you already run an APM stack, since OpenTelemetry's specification lets LLM spans sit alongside your existing service traces rather than living in a separate silo.
Storage choice depends on scale. A single SQLite file is enough for local development or a small production service, and some lightweight open-source tracers ship with exactly that as the default, letting you migrate to ClickHouse or a managed backend once volume justifies it. Whatever you choose, make sure your session correlation attribute (a session.id or conversation.id field) is consistent across every span in a multi-turn agent, or your trace tree will fragment into disconnected fragments.
Pro Tip: Start with the SDK wrapper for your primary model provider even if you plan to move to OTLP later. You get usable traces in an afternoon instead of a sprint, and you can layer OTLP export on top once the schema is stable.
A Five-Step Playbook to Start Tracing This Week
You don't need a platform team to get meaningful traces flowing. Here's the order that gets you from zero to production-safe fastest.
-
Pick a minimal schema. Before writing code, decide on the fields every trace must carry: request ID, timestamp, prompt, model, token counts, latency, status, and a metadata blob for anything custom. Resist the urge to capture everything on day one; a schema with eight fields you actually query beats one with thirty you don't.
-
Instrument one endpoint. Wrap a single high-traffic call, or one agent run, with your chosen method (SDK wrapper or OTLP exporter), and verify traces show up in your storage layer before touching anything else. Projects like path_tracker show a useful pattern here: log the provider, model, and full prompt/response pair alongside token counts so cost and path queries work from day one.
-
Add cost fields and evaluation hooks. Once traces are flowing, attach a computed cost field (token counts times your provider's per-token rate) and connect an automated evaluation, an LLM-as-a-Judge score, for example, to each trace. This is where regression detection starts working automatically instead of waiting for a support ticket.
-
Harden before rollout. Add sampling (trace 10 to 20% of low-value traffic, 100% of errors), PII redaction on prompt fields, asynchronous writes so tracing never blocks the response path, and a circuit breaker that disables tracing entirely if your storage backend starts timing out.
-
Build dashboards and alerts. Track p50/p95 latency, daily cost, and evaluation score trends. Alert on sudden spikes in any of the three, since a cost spike and a latency spike often share the same root cause: a prompt change that ballooned token usage.
Pro Tip: Wire your circuit breaker to fail open, not closed. If your tracing backend goes down, the LLM request should still succeed; you just lose that one trace. Losing traces is annoying. Losing production traffic because your observability layer fell over is a much worse Tuesday.
What Traces Actually Solve Once They're Running
Traces earn their keep the first time a user reports a bad response and you can pull the exact trace tree instead of asking them to reproduce it. You see the full prompt, the model's response, and every intermediate tool call in one view, which turns a support escalation into a five-minute fix.
Beyond debugging, traces unlock a handful of concrete workflows:
- Cost attribution: token counts per trace, rolled up by feature or customer, tell you which prompts are expensive and which are just noisy.
- Agent troubleshooting: multi-step agents fail in the branch you didn't expect; a trace shows exactly which tool call or retrieval step went sideways.
- Regression detection: linking an evaluation score to every trace means a prompt change that quietly degrades quality shows up as a dip in a dashboard, not a spike in complaints.
- Usage analytics: aggregate trace data across a week or a release cycle reveals which model, provider, or prompt version is actually performing best in production, not just in your test set.
Sampling, PII, and the Performance Cost Nobody Mentions
Tracing every request in a high-volume system gets expensive fast, both in storage and in the compute needed to write and query it. A sampling policy, full capture on errors and low-latency traffic, reduced sampling on high-volume success paths, keeps storage costs predictable without losing the traces that matter most.
Prompts and responses routinely contain names, emails, and account details. Redact or encrypt those fields at write time rather than after the fact, and gate access to raw trace data behind the same role-based controls you'd apply to production logs.
Performance-wise, synchronous trace writes are the most common mistake. Route writes through an async queue so a slow storage backend never adds latency to the user-facing request. As inference costs continue falling, Gartner projects that request volume, and the tracing load that comes with it, will keep climbing well past 2026.
- Set retention windows by trace value (errors longer, routine success shorter)
- Redact PII fields before persistence, not after
- Write traces asynchronously; never block the model response
- Alert on sudden volume or cost spikes in the tracing pipeline itself
Gartner also forecasts that explainable AI requirements will push LLM observability investment to 50% of AI budgets by 2028, which means the sampling and retention decisions you make now will only get more scrutiny, not less.
Why Trace-Linked Evaluation Changes the Debugging Equation
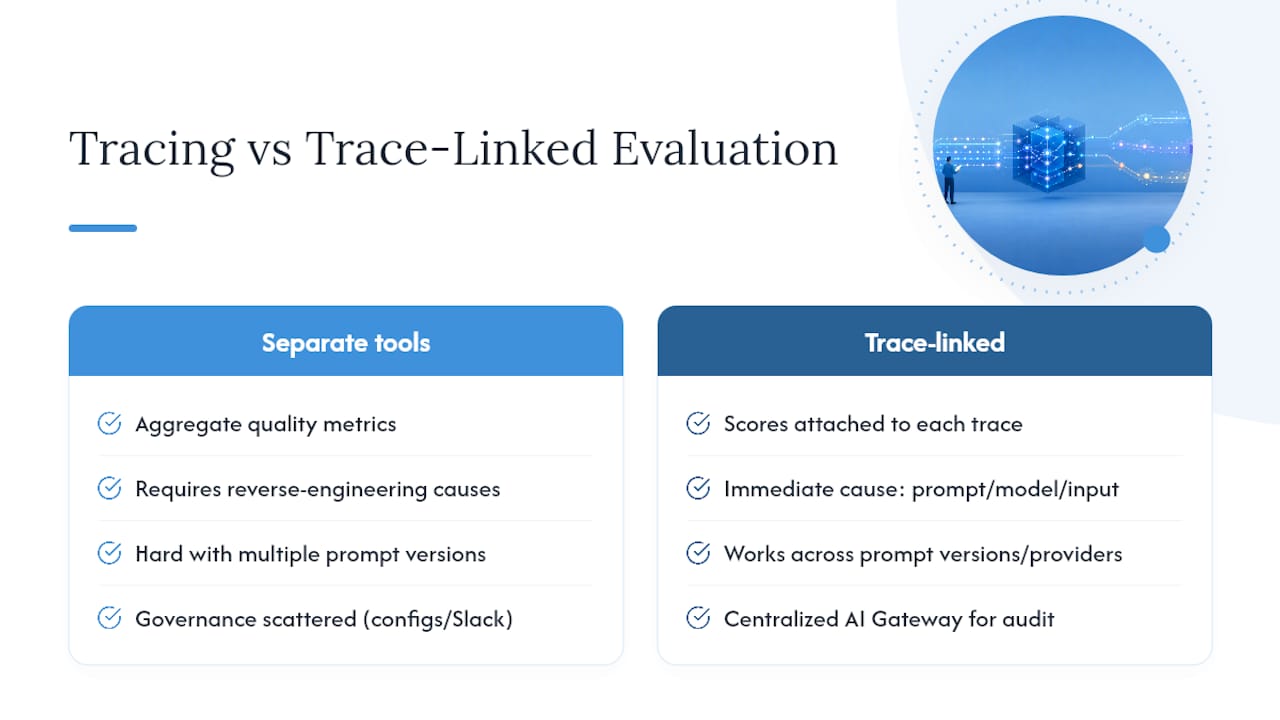
Most teams treat tracing and evaluation as separate tools, one for "what happened," the other for "was it good." That split is the reason so many regressions get caught by users instead of dashboards. MLflow's approach to LLM tracing attaches LLM-as-a-Judge scores directly to individual traces, so a quality dip shows up tied to the exact prompt, model version, and input that caused it, not as an aggregate metric you have to reverse-engineer.
This matters more once you're running multiple prompt versions or model providers at once. A centralized AI Gateway with prompt versioning gives you one place to see which version is live, roll back a bad change, and audit who touched what, instead of scattering that governance across config files and Slack threads. Teams that wire evaluation scores directly to traces report catching regressions automatically rather than through manual spot-checks, which is the whole point of building this pipeline in the first place.
— Kevin
Getting Started With MLflow's Tracing and Evaluation Tools
Tracing, automated evaluation, and prompt governance can be provided in a single open-source platform instead of stitching together three separate tools. Its LLM tracing captures the full trace/span/observation model described above, including agent tool calls and retrieval steps, and connects each trace to an LLM-as-a-Judge evaluation so regressions surface as they happen instead of after a customer notices.

If you're currently duct-taping a logging library to a spreadsheet for cost tracking, that's the exact gap MLflow's AI observability tooling is built to close, without asking you to run a separate paid backend just to get queryable traces. The GenAI platform page walks through the quickstart for agent tracing and evaluation setup, and it's a reasonable next stop if you want to see the schema and the evaluation hooks in practice before you commit engineering time to build your own.