How to trace Claude agents via Native OpenTelemetry Export

Agents built on Claude can run for dozens of turns on a single task: calling the model, running tools, and calling the model again after each step. When a run goes wrong, the final answer rarely tells you why. Which tool call returned something unexpected? How many tokens did that long run actually burn, and what did it cost?
Claude can now answer those questions natively. Claude Managed Agents, the Messages API, the Claude SDKs, and Claude Code all emit OpenTelemetry (OTel) traces, covering each model request and tool call, and any backend that speaks the OpenTelemetry Protocol (OTLP) can receive them. You need no adapter code and no collector.
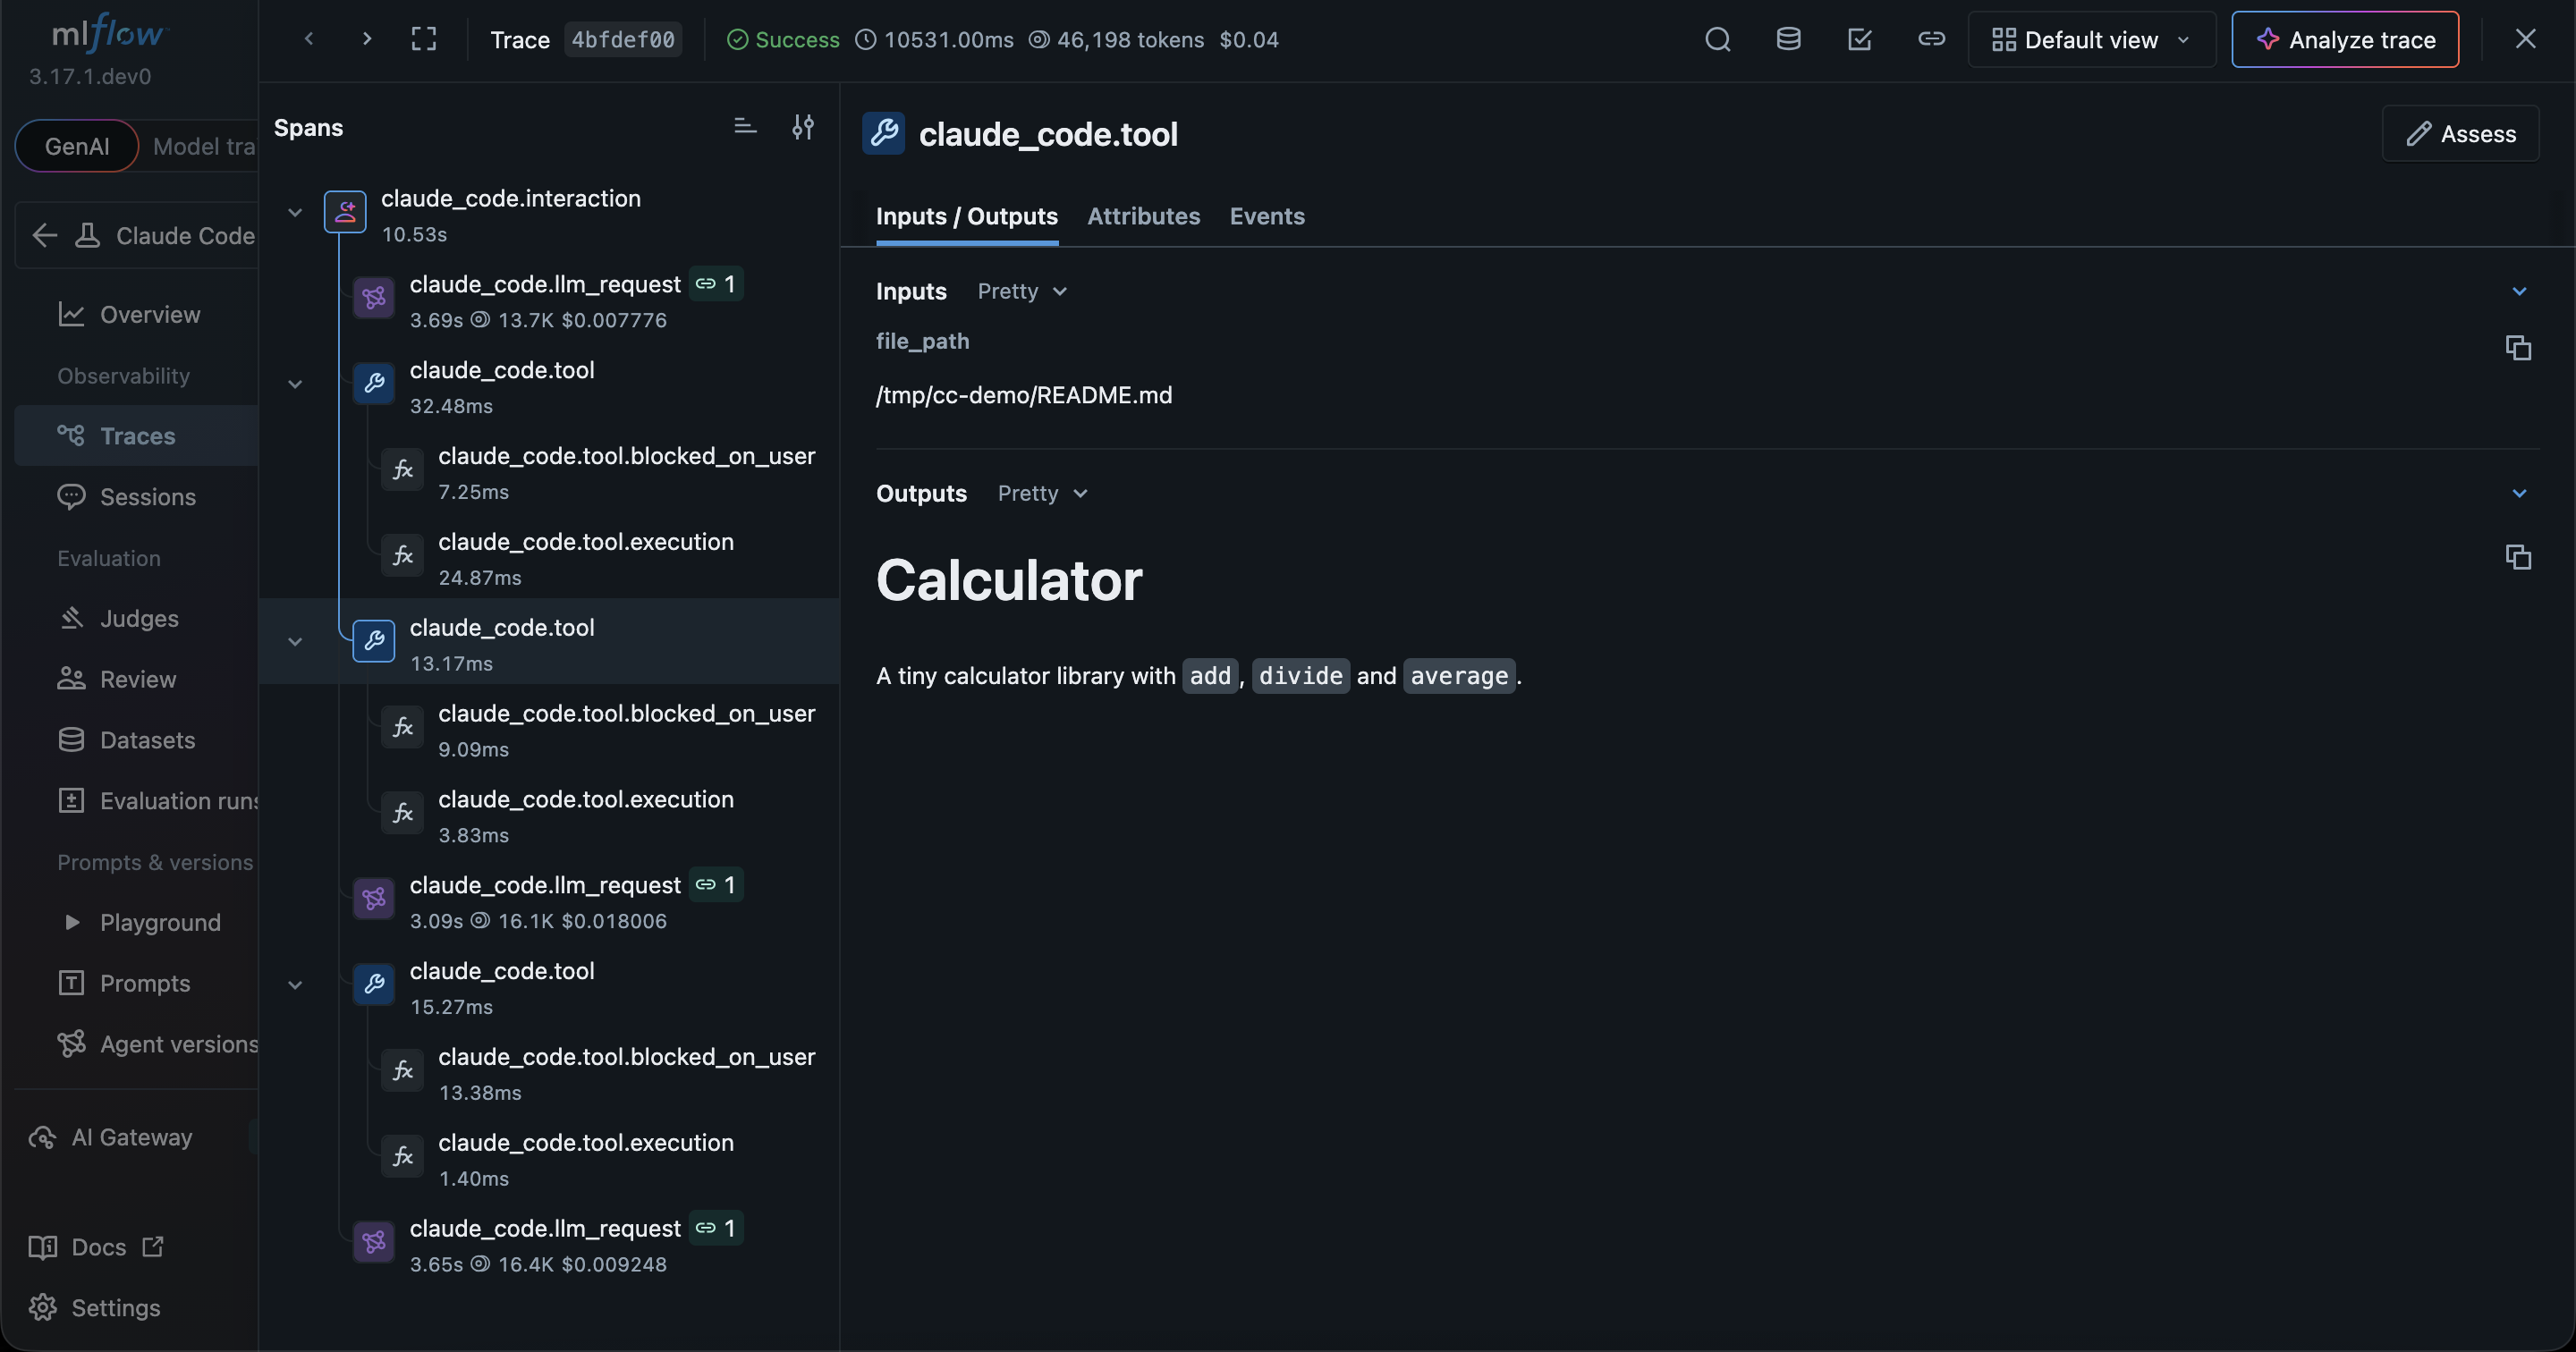
This tutorial shows how to set up that export for each Claude product. We send the traces to MLflow because it is open source and doesn't need a sign-up for any service.
How it fits together
Claude sends traces with OTLP over HTTP. In this tutorial they go to a local MLflow server, which receives them at /v1/traces:
+----------------+                         +---------------+            +------------+
|  Claude Code   |                         | MLflow server |            |   MLflow   |
|   Agent SDK    |        OTLP/HTTP        |               |            | tracing UI |
|  Claude SDKs   | ----------------------> |   translates  | ---------> |            |
|  Messages API  |     POST /v1/traces     |  Claude spans |            |            |
| Managed Agents |                         |               |            |            |
+----------------+                         +---------------+            +------------+
SDK vs. Platform export
- Platform export: Configure Claude Platform to send server-side model runs, Managed Agents turns, and server tool activity to MLflow.
- SDK export: Capture SDK requests, local tool activity, and custom spans from your app. Configure its exporter and content mode separately.
- Use both: Send both to the same MLflow experiment to connect client and server spans. Claude Platform on AWS keeps API spans in separate traces.
See Anthropic's OpenTelemetry guide for details.
Prerequisites
- MLflow 3.17.1 or newer on the server side (
pip install "mlflow>=3.17.1") - The Claude product you want to trace.
Step 1: Start an MLflow server and create an experiment
Start an MLflow server locally:
mlflow server --host 127.0.0.1 --port 5000
Create an experiment for your traces (mlflow experiments create -n claude-traces) and note its numeric ID. You will pass that ID to Claude in the next step, to specify which experiment the traces belong to.
Step 2: Send Claude traces via OTLP
MLflow receives traces at http://<your-server>/v1/traces, with the header x-mlflow-experiment-id: <your experiment ID>.
Claude Platform UI: Messages API and Managed Agents
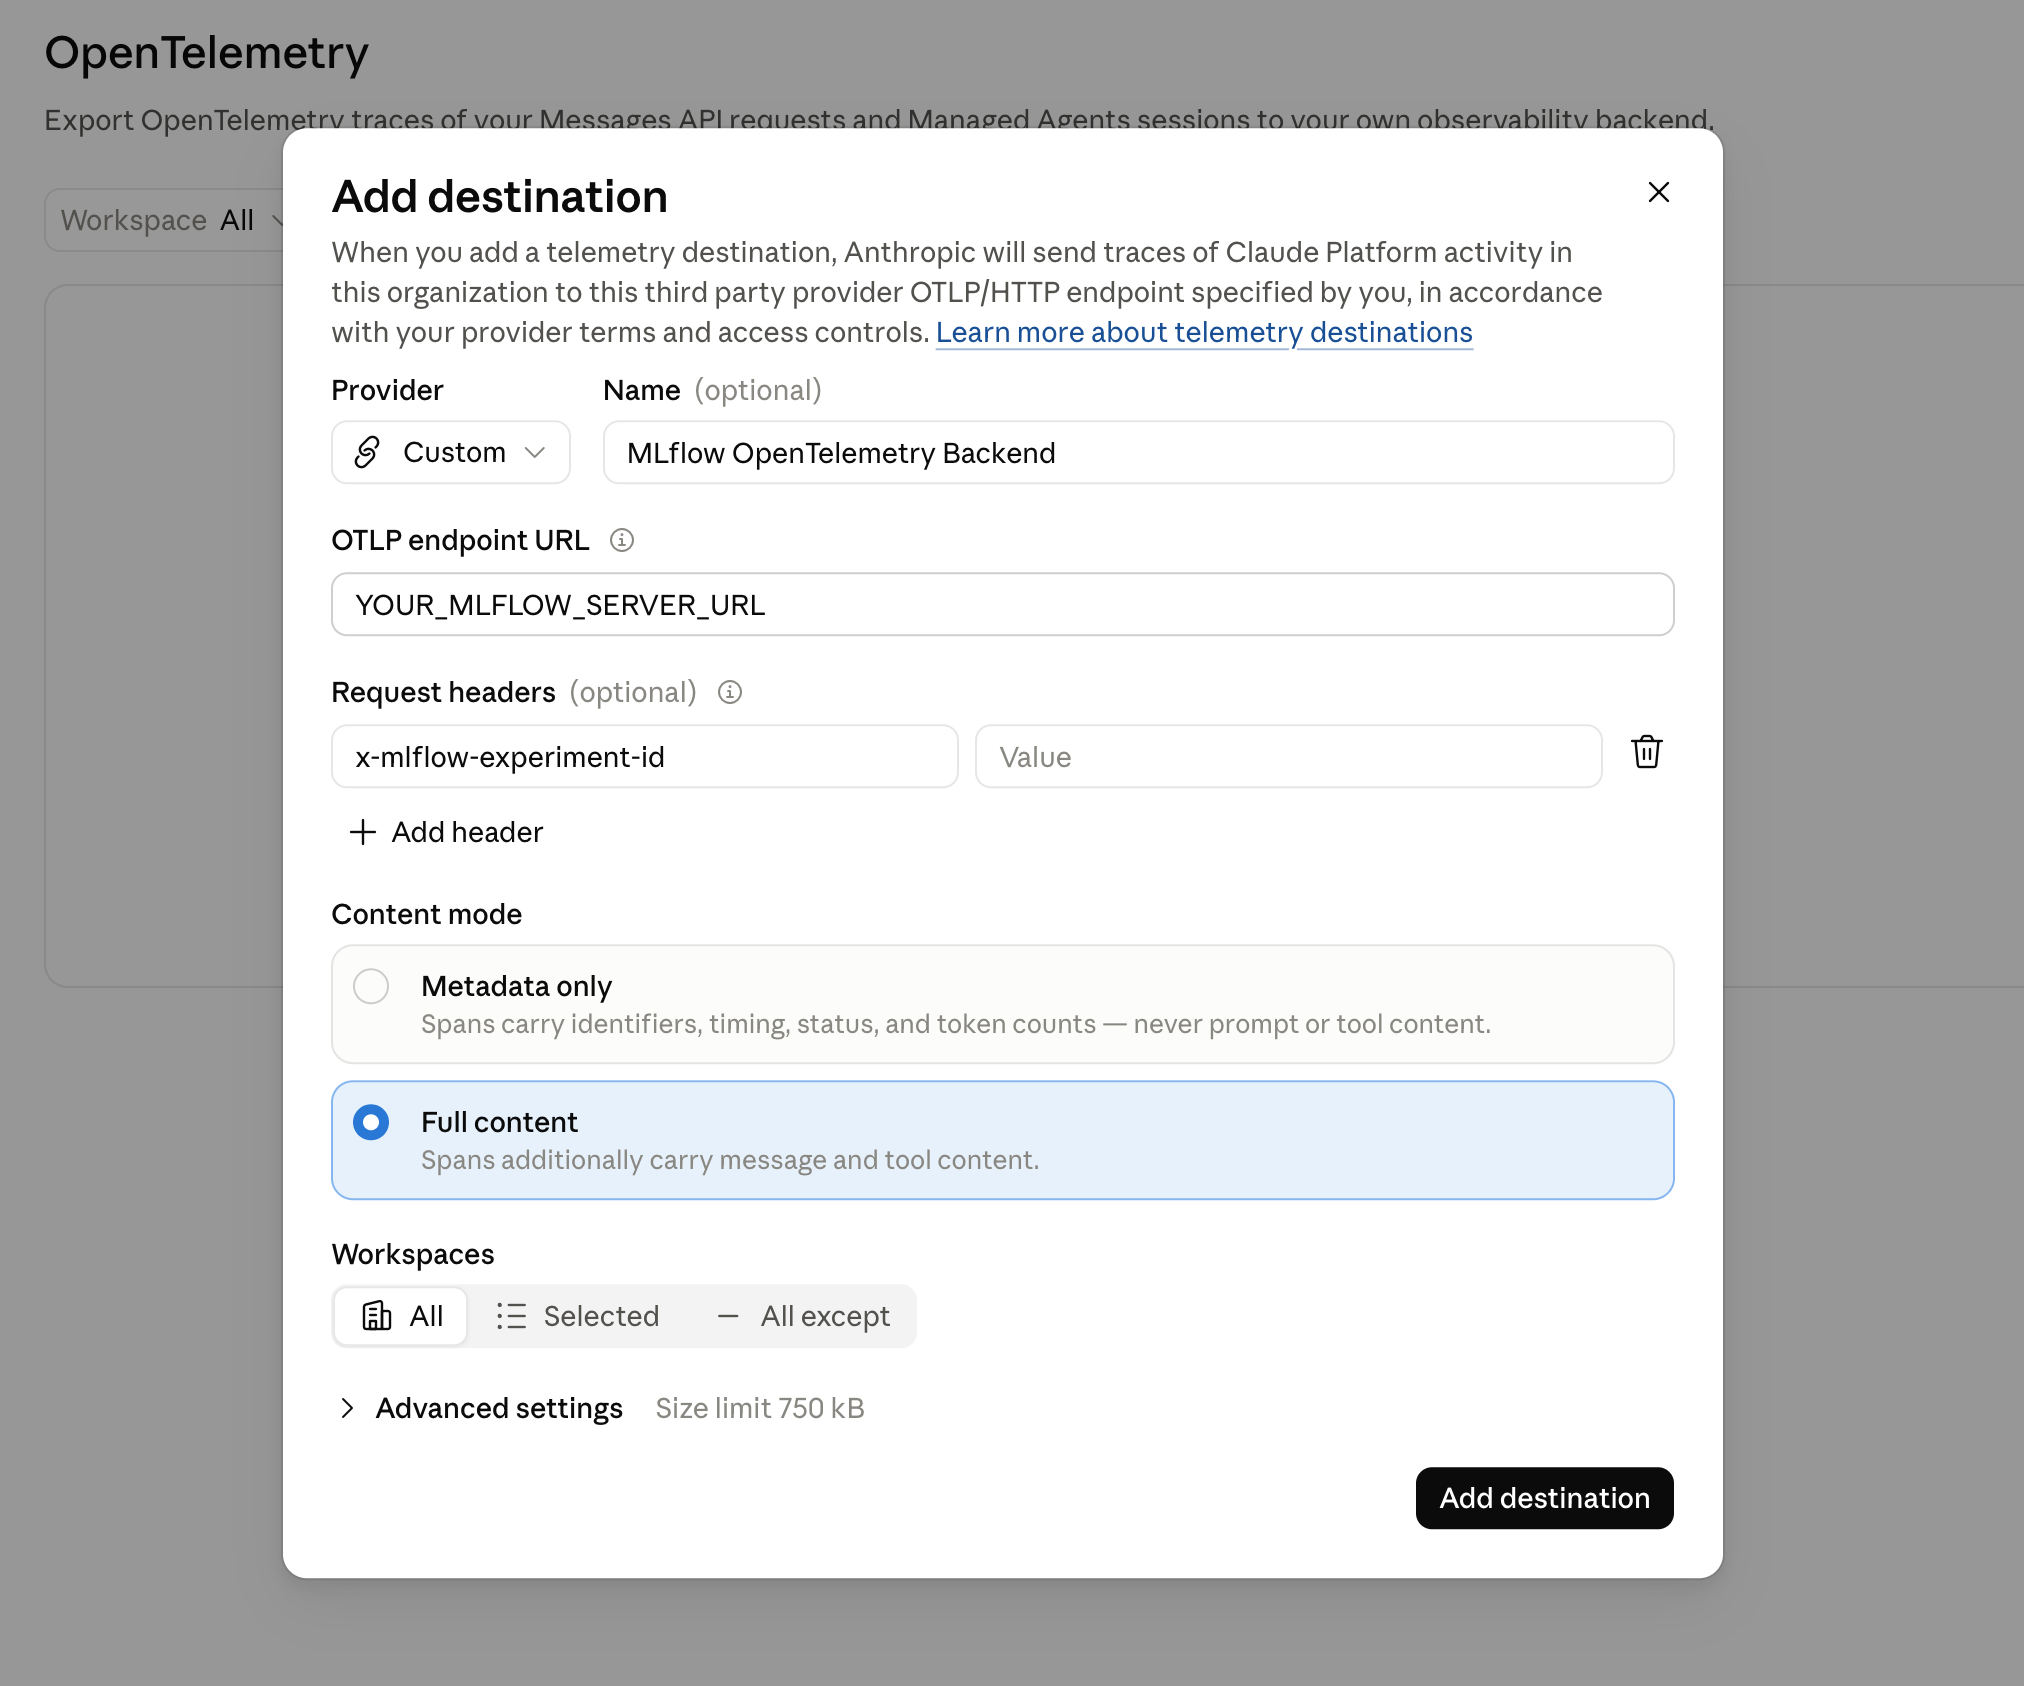
In Claude Platform, open OpenTelemetry → + Add destination and choose Custom. Set OTLP endpoint URL to your server's base HTTPS URL, such as https://YOUR_MLFLOW_SERVER, without /v1/traces: Claude Platform appends it automatically.
Under Request headers, add x-mlflow-experiment-id with your experiment ID. If your server uses MLflow basic authentication, also add an Authorization header. Its value is Basic followed by the Base64-encoded username:password. Generate the complete value locally with:
python3 -c '
import base64
import getpass

username = input("MLflow username: ")
password = getpass.getpass("MLflow password: ")
print("Basic " + base64.b64encode(f"{username}:{password}".encode()).decode())
'
Paste the output directly into the Authorization value field, keeping the space after Basic; do not URL-encode it. For a server that accepts bearer tokens, use Bearer YOUR_TOKEN instead.
Platform export cannot reach a server running only on your machine (localhost). Set up a remote MLflow server with an HTTPS endpoint Anthropic can reach, or use managed MLflow from Databricks, AWS, or Red Hat.
Choose Full content to record message and tool content for deeper analysis and evaluation, or Metadata only for statistics such as latency and token counts. Select your workspaces and click Add destination.
Claude SDKs and the Messages API
The Claude SDKs create an OpenTelemetry span for each Messages API call. Like other OpenTelemetry-native libraries, they send spans to whatever exporter your application sets up, so the only setup is to point an OpenTelemetry exporter at MLflow before you create the client.
Python:
pip install anthropic opentelemetry-sdk opentelemetry-exporter-otlp-proto-http
import anthropic
from opentelemetry import trace
from opentelemetry.exporter.otlp.proto.http.trace_exporter import OTLPSpanExporter
from opentelemetry.sdk.trace import TracerProvider
from opentelemetry.sdk.trace.export import BatchSpanProcessor

provider = TracerProvider()
provider.add_span_processor(
    BatchSpanProcessor(
        OTLPSpanExporter(
            endpoint="http://127.0.0.1:5000/v1/traces",
            headers={"x-mlflow-experiment-id": "YOUR_EXPERIMENT_ID"},
        )
    )
)
trace.set_tracer_provider(provider)

client = anthropic.Anthropic()
message = client.messages.create(
    model="claude-sonnet-5-5",
    max_tokens=1024,
    messages=[{"role": "user", "content": "Hello, Claude"}],
)
TypeScript:
npm install @anthropic-ai/sdk @opentelemetry/sdk-trace-node@^2.11.0 @opentelemetry/sdk-trace-base@^2.11.0 @opentelemetry/exporter-trace-otlp-proto@^0.222.0
import Anthropic from "@anthropic-ai/sdk";
import { NodeTracerProvider } from "@opentelemetry/sdk-trace-node";
import { BatchSpanProcessor } from "@opentelemetry/sdk-trace-base";
import { OTLPTraceExporter } from "@opentelemetry/exporter-trace-otlp-proto";

const provider = new NodeTracerProvider({
  spanProcessors: [
    new BatchSpanProcessor(
      new OTLPTraceExporter({
        url: "http://127.0.0.1:5000/v1/traces",
        headers: { "x-mlflow-experiment-id": "YOUR_EXPERIMENT_ID" },
      }),
    ),
  ],
});
provider.register();

const client = new Anthropic();
const message = await client.messages.create({
  model: "claude-sonnet-5-5",
  max_tokens: 1024,
  messages: [{ role: "user", content: "Hello, Claude" }],
});
The SDK exports metadata only by default; set this to include prompts and responses in the spans:
# Optional: include prompts and responses in the spans (metadata only by default).
export ANTHROPIC_OPEN_TELEMETRY_TRACES_CONTENT_MODE=content
Claude Managed Agents
Claude Managed Agents run on Anthropic's infrastructure, so their server-side traces are exported from the Claude Platform UI: follow the Claude Platform UI setup above. Anthropic sends the traces, so the server needs a URL Anthropic can reach; turn on MLflow authentication before you expose it.
Claude Code
Claude Code's OTel export is configured entirely through environment variables. The first six are required; the last three are optional. Add them to your shell (or to a .env file you source before launching claude):
# Required: turn telemetry on and enable trace spans.
export CLAUDE_CODE_ENABLE_TELEMETRY=1
export CLAUDE_CODE_ENHANCED_TELEMETRY_BETA=1

# Required: export traces with OTLP over HTTP.
export OTEL_TRACES_EXPORTER=otlp
export OTEL_EXPORTER_OTLP_TRACES_PROTOCOL=http/protobuf

# Required: the MLflow endpoint (note the full /v1/traces path), and the
# x-mlflow-experiment-id header that tells MLflow where to file the traces.
export OTEL_EXPORTER_OTLP_TRACES_ENDPOINT=http://127.0.0.1:5000/v1/traces
export OTEL_EXPORTER_OTLP_TRACES_HEADERS=x-mlflow-experiment-id=YOUR_EXPERIMENT_ID

# Optional: include prompt and tool content, which is redacted by default.
export OTEL_LOG_USER_PROMPTS=1
export OTEL_LOG_TOOL_DETAILS=1
export OTEL_LOG_TOOL_CONTENT=1
Launch claude and work normally. Each prompt you submit is exported as its own trace within a few seconds.
Claude Agent SDK
The Claude Agent SDK (Python and TypeScript) runs the Claude Code CLI as a child process and passes configuration through to it, so it uses the Claude Code setup above: set those environment variables in the process that starts the SDK, and each prompt produces a trace, as it does with the CLI.
Python: the SDK merges its env option onto the inherited environment, so exporting the variables before running your script is enough:
import asyncio

from claude_agent_sdk import ClaudeAgentOptions, query


async def main():
    # The OTel environment variables above are inherited by the CLI child
    # process, so no SDK-specific configuration is needed.
    async for message in query(
        prompt="Summarize the failing tests in this repo",
        options=ClaudeAgentOptions(),
    ):
        print(message)


asyncio.run(main())
TypeScript: one real gotcha: options.env replaces the child process environment rather than extending it. If you pass an env object, spread process.env first, or your OTel variables will never reach the CLI:
import { query } from "@anthropic-ai/claude-agent-sdk";

for await (const message of query({
  prompt: "Summarize the failing tests in this repo",
  options: {
    env: {
      // options.env replaces the environment, so inherit it explicitly:
      ...process.env,
      CLAUDE_CODE_ENABLE_TELEMETRY: "1",
      CLAUDE_CODE_ENHANCED_TELEMETRY_BETA: "1",
      OTEL_TRACES_EXPORTER: "otlp",
      OTEL_EXPORTER_OTLP_TRACES_PROTOCOL: "http/protobuf",
      OTEL_EXPORTER_OTLP_TRACES_ENDPOINT: "http://127.0.0.1:5000/v1/traces",
      OTEL_EXPORTER_OTLP_TRACES_HEADERS:
        "x-mlflow-experiment-id=YOUR_EXPERIMENT_ID",
      OTEL_LOG_USER_PROMPTS: "1",
      OTEL_LOG_TOOL_DETAILS: "1",
      OTEL_LOG_TOOL_CONTENT: "1",
    },
  },
})) {
  console.log(message);
}
Two SDK-specific caveats:
- Do not use the
consoleOTel exporter through the SDK. The SDK and the CLI communicate over stdout, and console export corrupts that channel. Use theotlpexporter as shown. - Exporter failures are silent by default. If traces are not arriving, set
CLAUDE_CODE_OTEL_DIAG_STDERR=1to get OTel diagnostics on stderr instead of guessing.
Step 3: Inspect the traces in MLflow
Open the experiment's Traces tab. Each agent run or request shows up as one trace, with token and cost totals on the row. Open a trace to see each model call and tool call as a step, with its token counts.
Going deeper with Claude Code: response text and context snapshots
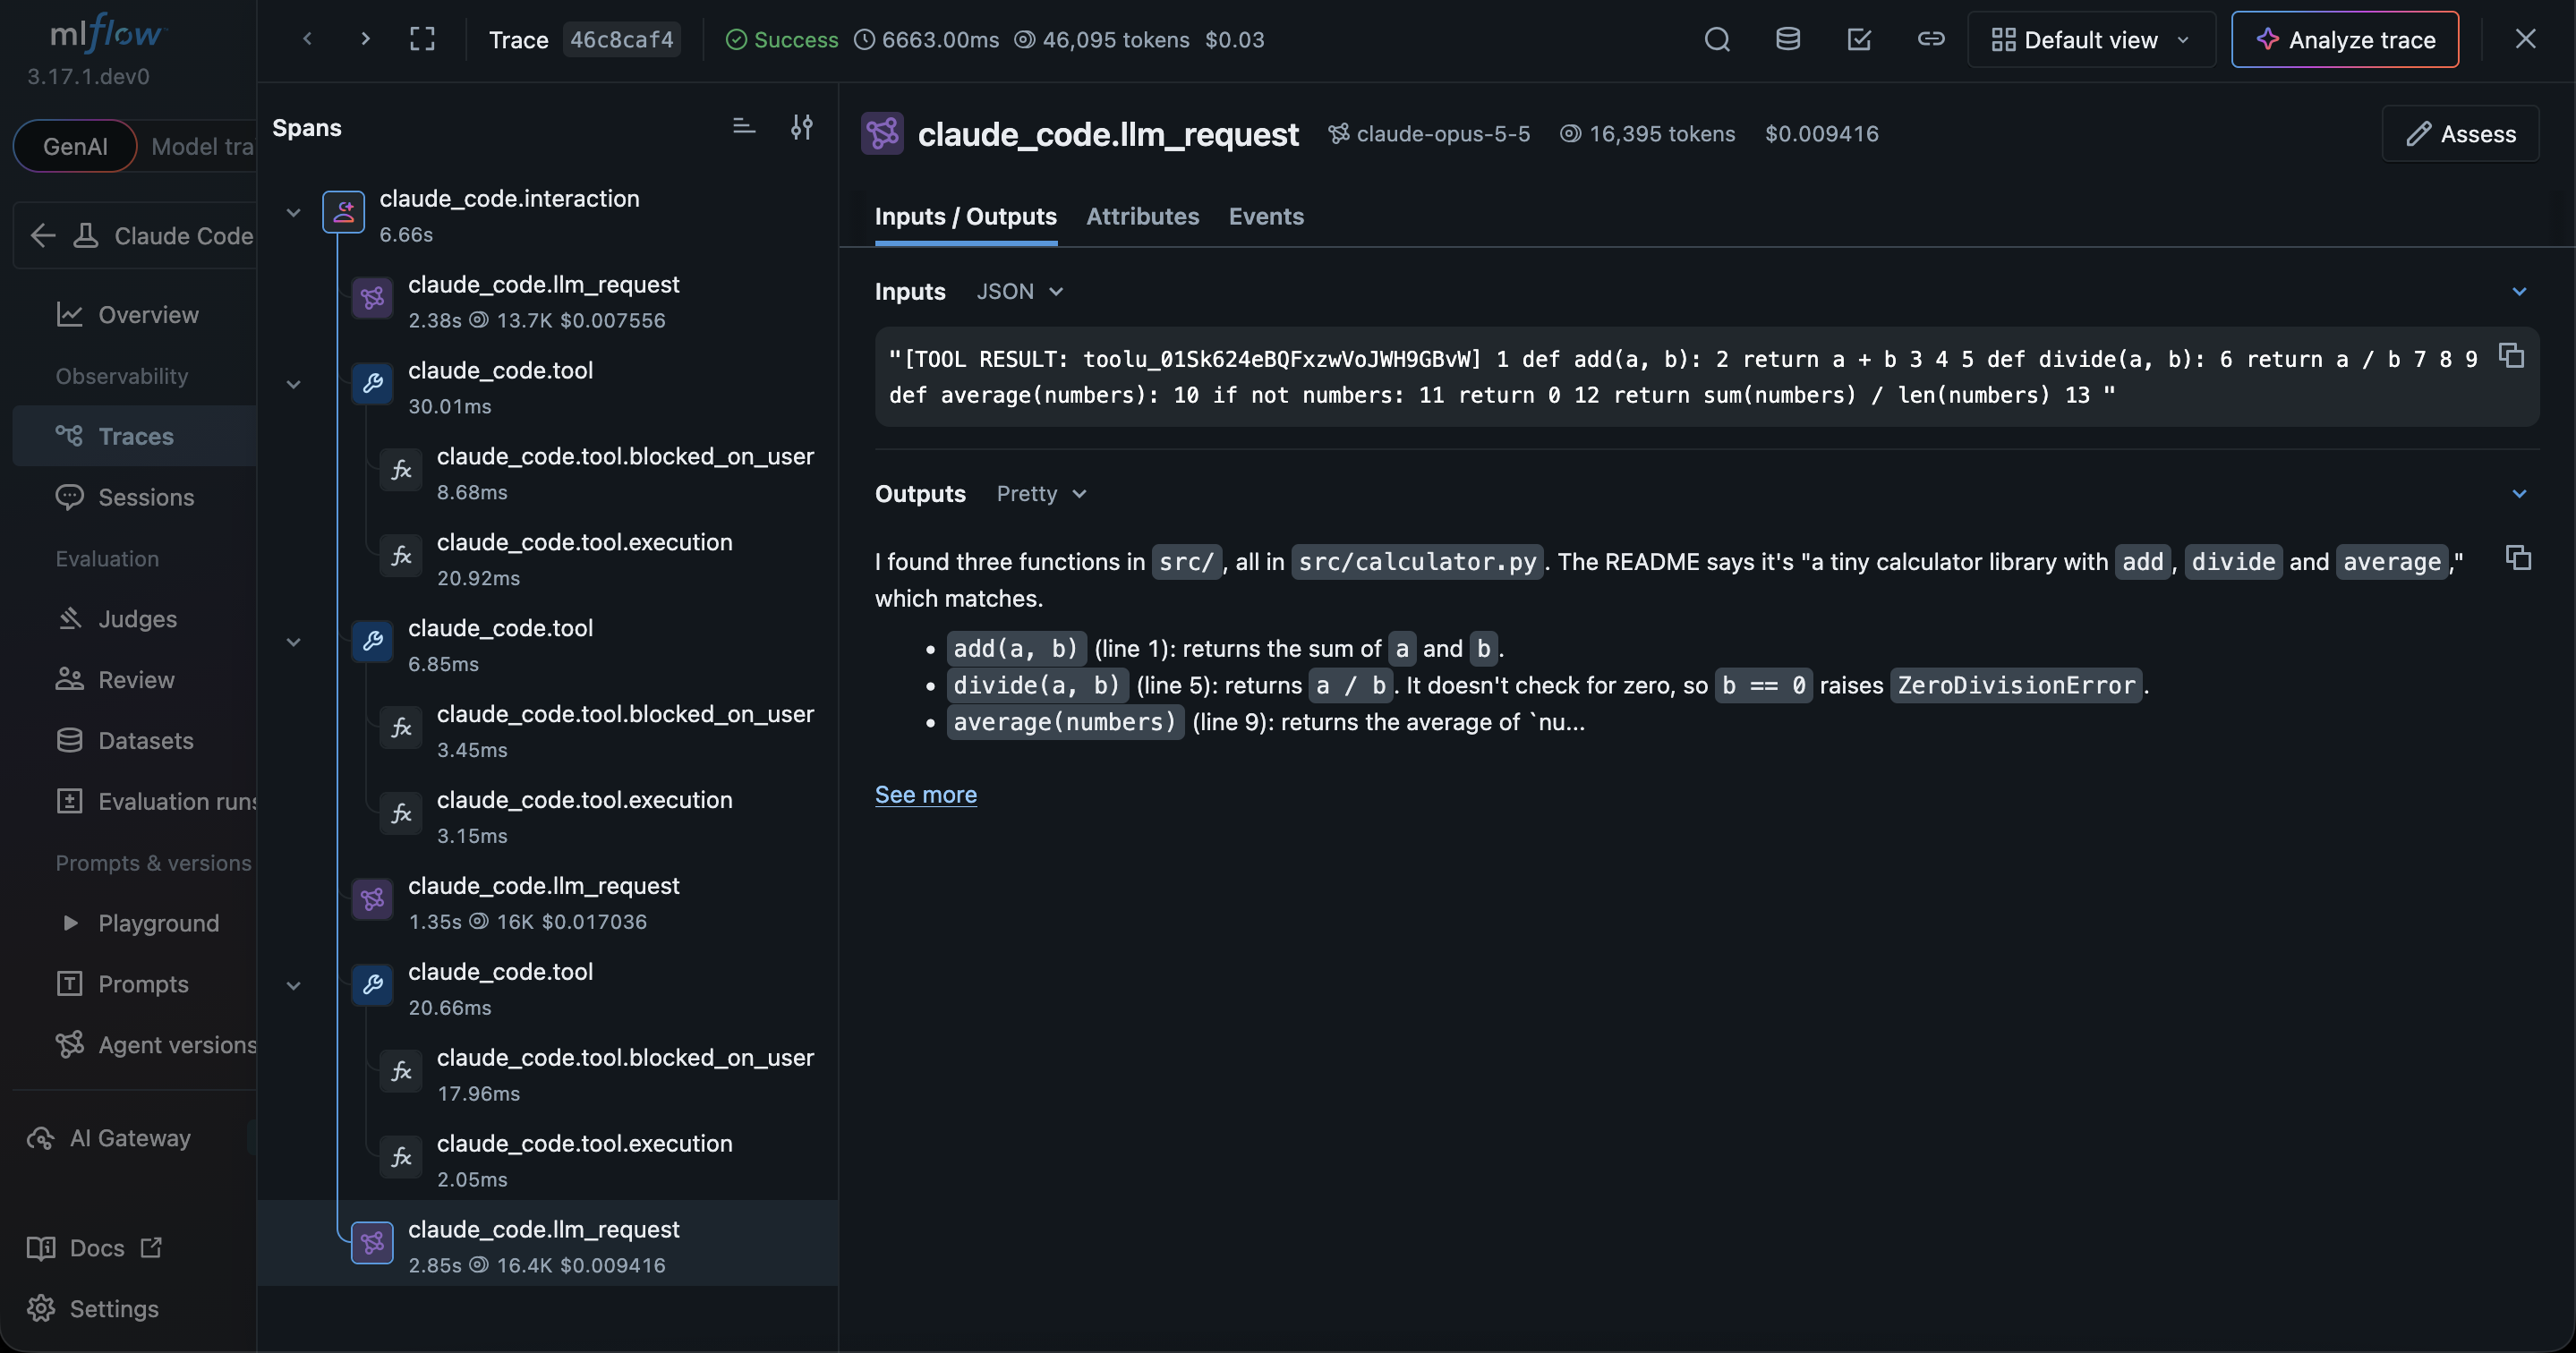
By default, Claude Code's model-request spans carry token counts but not the model's response text, and the exact context sent to the model is not included in the export. Claude Code has an additional detailed-tracing mode for exactly this. Setting
export ENABLE_BETA_TRACING_DETAILED=1
export BETA_TRACING_ENDPOINT=http://127.0.0.1:5000
adds response.model_output (the model's reply), new_context (the context snapshot), tool_input (tool inputs in full), and a few system-prompt attributes. Keep the Step 2 variables set too: the experiment header still comes from OTEL_EXPORTER_OTLP_TRACES_HEADERS. The model's reply then appears as the model call's output:
Troubleshooting
- No Claude Code traces appear. Confirm both
CLAUDE_CODE_ENABLE_TELEMETRYandCLAUDE_CODE_ENHANCED_TELEMETRY_BETAare set. The first is the master switch, the second enables span tracing. SetCLAUDE_CODE_OTEL_DIAG_STDERR=1to surface exporter errors. - Everything is
<REDACTED>in Claude Code traces. That is the privacy default; set theOTEL_LOG_*toggles from Step 2.
Wrapping up
Your Claude agents now tell you what they did. Because the setup is plain OTLP, it works the same way with other OTLP backends; only the endpoint and headers change.
Ready to try it yourself?
- Get started with MLflow Tracing to capture and inspect your own agent runs.
- Explore the demo experiment to browse traces in MLflow without setting up a server.
- Read the OpenTelemetry guide for OTLP configuration and integration details.
Questions or feedback? Reach out to our community on Slack, or file a GitHub issue.