Tracing Gemini CLI
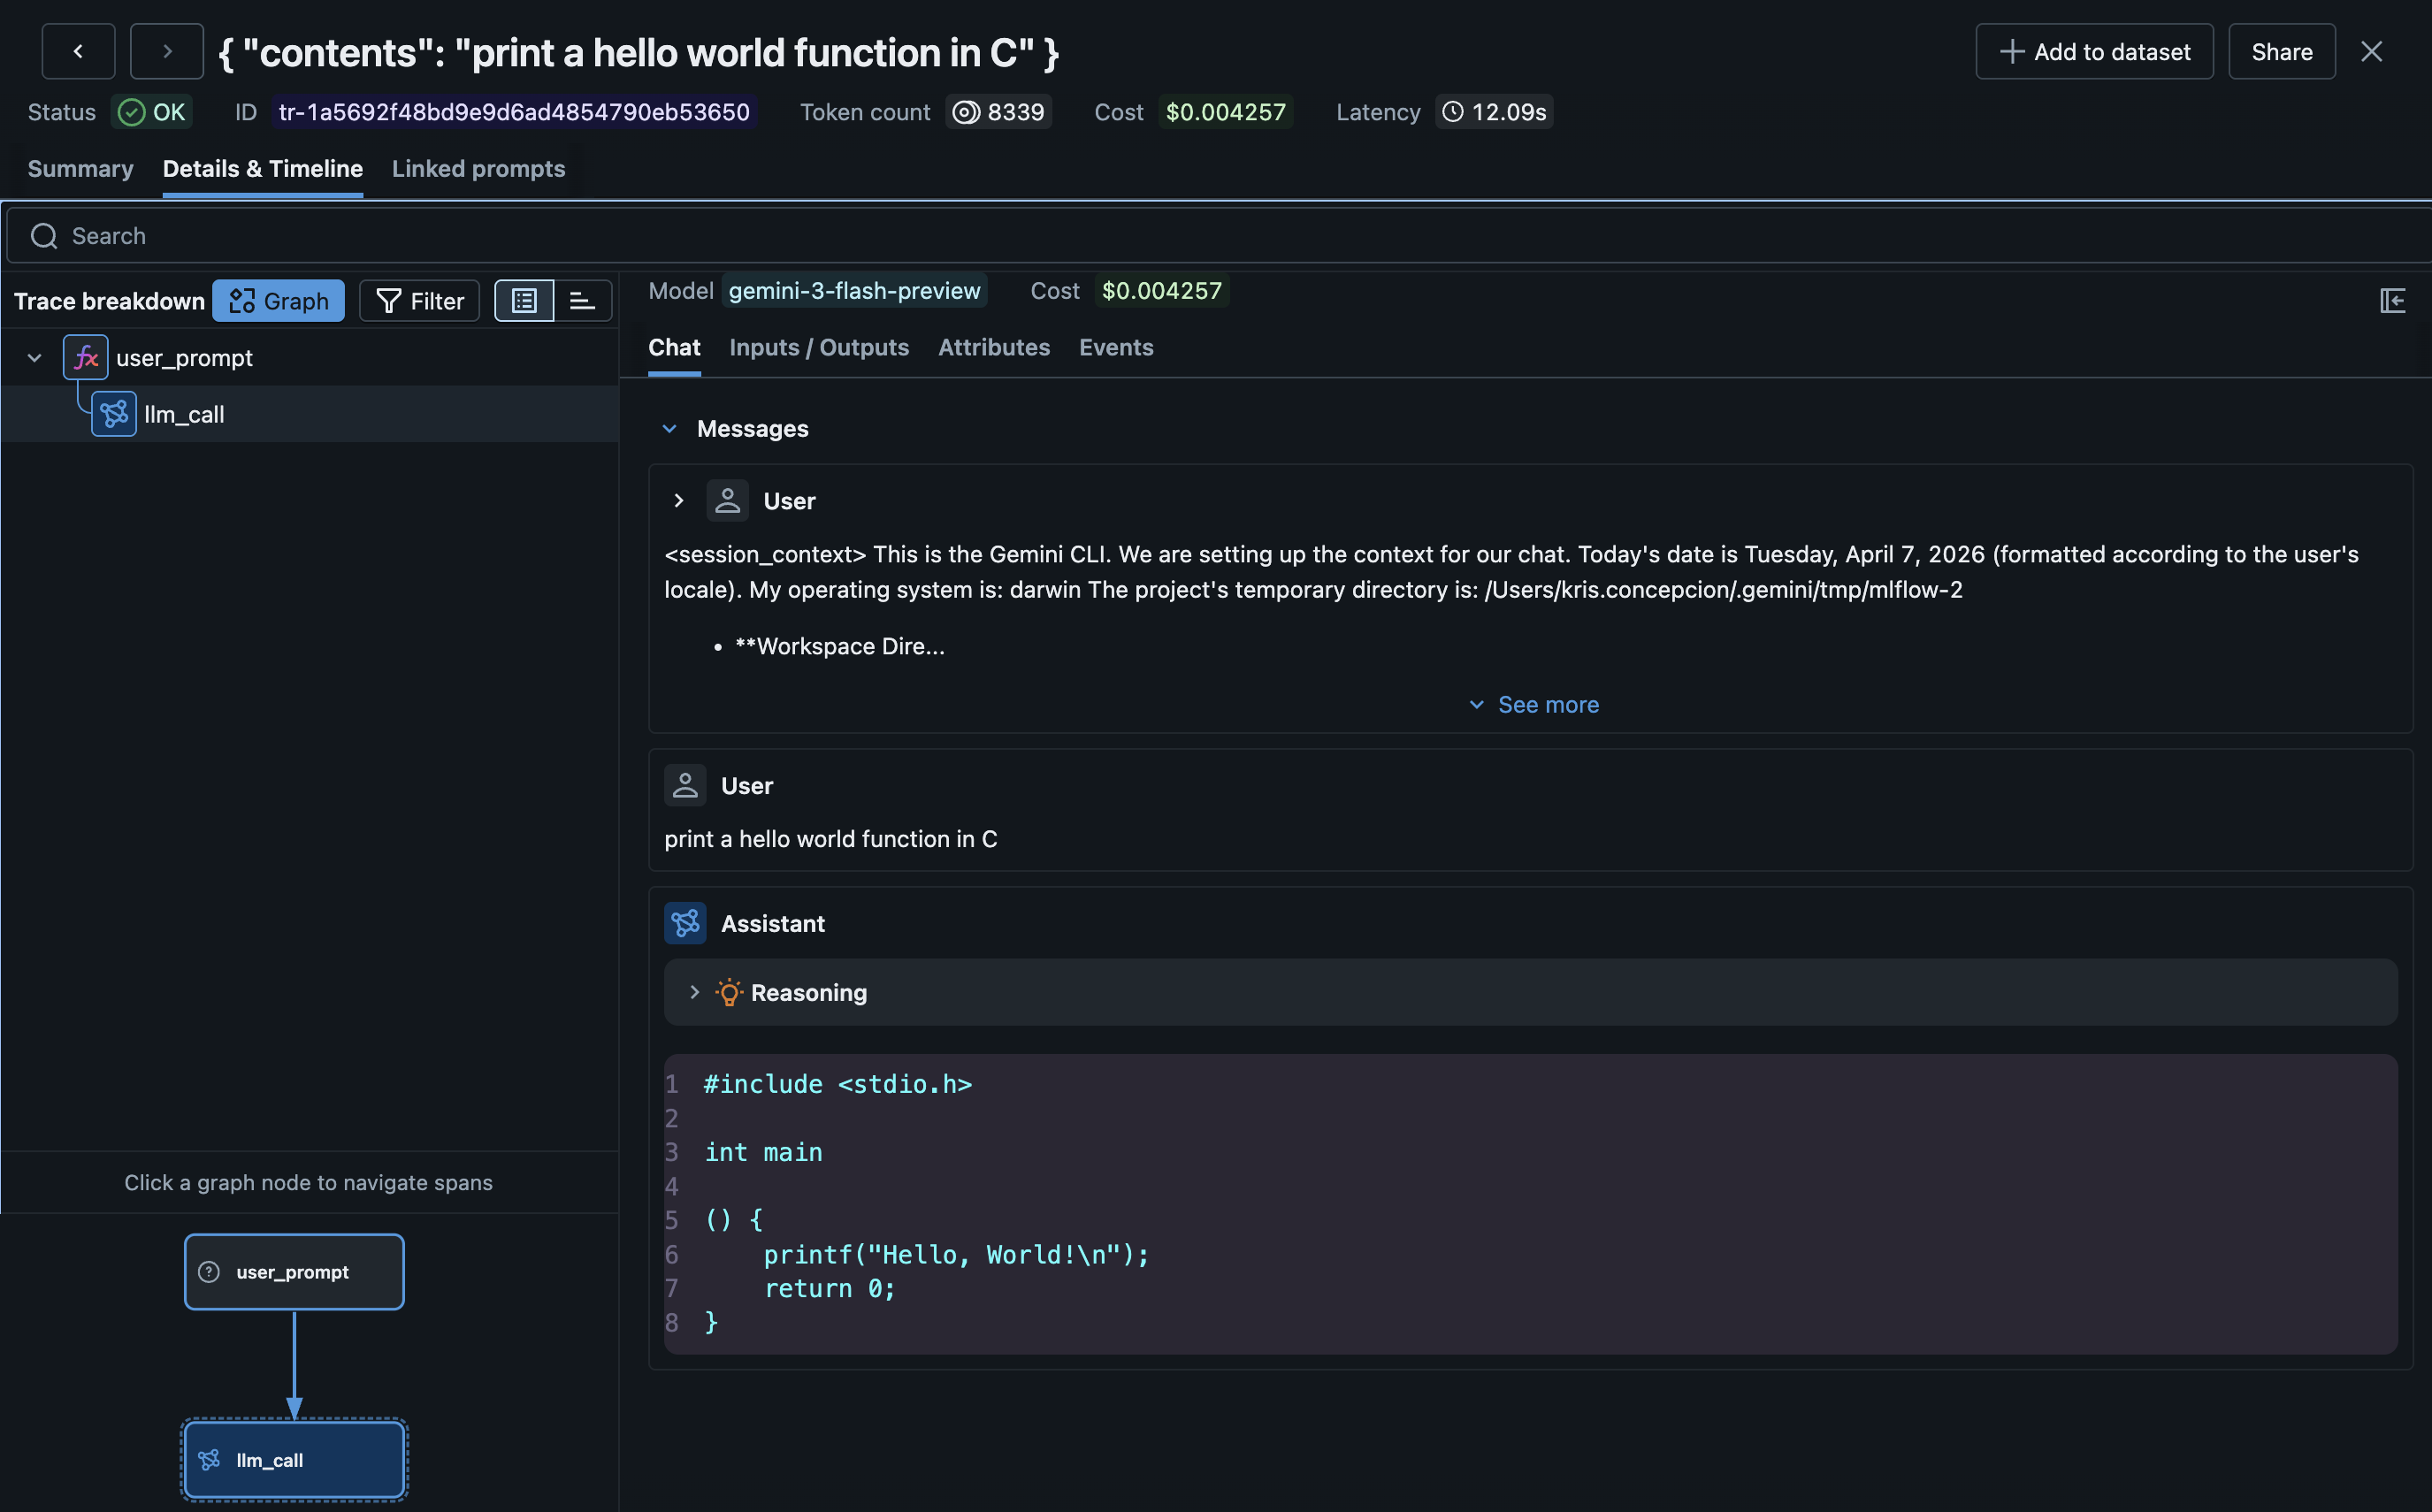
MLflow Tracing provides automatic tracing for Gemini CLI, Google's open-source terminal-based coding agent. Gemini CLI has built-in OpenTelemetry support that sends rich conversation traces directly to MLflow's OTLP endpoint. Traces automatically capture:
- User prompts and assistant responses (including thinking/reasoning)
- LLM calls with model name, token usage, and cost
- Tool calls and their results
- Session metadata
Setup
Gemini CLI traces are ingested via its native OTLP telemetry --- no MLflow CLI command is needed.
Requirements
- MLflow tracking server (with the OTLP endpoint enabled)
- Gemini CLI installed (
npm install -g @google/gemini-cli) - Node.js 22+
Step 1: Set Environment Variables
# Enable Gemini telemetry and point it at MLflow
export GEMINI_TELEMETRY_ENABLED=true
export GEMINI_TELEMETRY_TARGET=local
export GEMINI_TELEMETRY_OTLP_ENDPOINT=http://localhost:5000
export GEMINI_TELEMETRY_OTLP_PROTOCOL=http

# Set the MLflow experiment ID via standard OTLP headers
export OTEL_EXPORTER_OTLP_HEADERS=x-mlflow-experiment-id=0
Step 2: Run Gemini CLI
# Tracing happens automatically
gemini
Traces are sent to MLflow in real time as you interact with Gemini CLI.
Step 3: View Traces
mlflow server
# Navigate to your experiment in the UI
Configuration Reference
| Environment Variable | Required | Description |
|---|---|---|
GEMINI_TELEMETRY_ENABLED | Yes | Set to true to enable telemetry |
GEMINI_TELEMETRY_TARGET | Yes | Set to local for custom OTLP endpoint |
GEMINI_TELEMETRY_OTLP_ENDPOINT | Yes | MLflow server base URL (e.g., http://localhost:5000). Gemini appends /v1/traces automatically |
GEMINI_TELEMETRY_OTLP_PROTOCOL | Yes | Must be http (MLflow does not support gRPC ingestion) |
OTEL_EXPORTER_OTLP_HEADERS | Yes | Set x-mlflow-experiment-id=<id> to route traces to a specific experiment |
Configuration Examples
# Local MLflow server, default experiment
export GEMINI_TELEMETRY_ENABLED=true
export GEMINI_TELEMETRY_TARGET=local
export GEMINI_TELEMETRY_OTLP_ENDPOINT=http://localhost:5000
export GEMINI_TELEMETRY_OTLP_PROTOCOL=http
export OTEL_EXPORTER_OTLP_HEADERS=x-mlflow-experiment-id=0

# Databricks-hosted MLflow
# See Databricks documentation for required authentication headers
export GEMINI_TELEMETRY_ENABLED=true
export GEMINI_TELEMETRY_TARGET=local
export GEMINI_TELEMETRY_OTLP_ENDPOINT=https://your-workspace.databricks.com
export GEMINI_TELEMETRY_OTLP_PROTOCOL=http
export OTEL_EXPORTER_OTLP_HEADERS=x-mlflow-experiment-id=123456789
How It Works
Gemini CLI emits OpenTelemetry traces using the GenAI semantic conventions. MLflow's OTLP endpoint ingests these traces and automatically:
- Maps span types:
llm_callto LLM,tool_callto TOOL,agent_callto AGENT - Extracts token usage: From
gen_ai.usage.input_tokensandgen_ai.usage.output_tokens - Calculates cost: Based on the model name from
gen_ai.request.model - Sets
service.name:gemini-cliis propagated to the root span for identification - Renders in Chat UI: Messages are displayed in MLflow's Chat view with thinking/reasoning parts
Token Usage and Cost
MLflow automatically extracts token usage from Gemini CLI's GenAI semantic convention attributes and calculates cost based on the model. See the Token Usage and Cost Tracking documentation for details.
Troubleshooting
No traces appearing:
-
Verify the protocol is set to
http(notgrpc):bashecho $GEMINI_TELEMETRY_OTLP_PROTOCOL # Should be "http" -
Check that the experiment ID header is set:
bashecho $OTEL_EXPORTER_OTLP_HEADERS # Should contain "x-mlflow-experiment-id=..." -
Check the MLflow server logs for incoming requests:
bash# Look for POST /v1/traces requeststail -f /tmp/mlflow-backend.log
400 Bad Request errors:
- Ensure
GEMINI_TELEMETRY_OTLP_PROTOCOL=httpis set. Without it, Gemini defaults to gRPC which MLflow does not support.
Traces appearing but empty:
- Gemini CLI sends a mix of traces. Simple prompts produce
user_prompt+llm_callspans. Complex tasks with tool use produce richer traces withagent_call,tool_call, and multiplellm_callspans.
Disable Tracing
Unset the telemetry environment variables:
unset GEMINI_TELEMETRY_ENABLED
unset GEMINI_TELEMETRY_TARGET
unset GEMINI_TELEMETRY_OTLP_ENDPOINT
Existing traces are preserved.