Tracing LiteLLM🚄
LiteLLM is an open-source LLM Gateway that allow accessing 100+ LLMs in the unified interface.
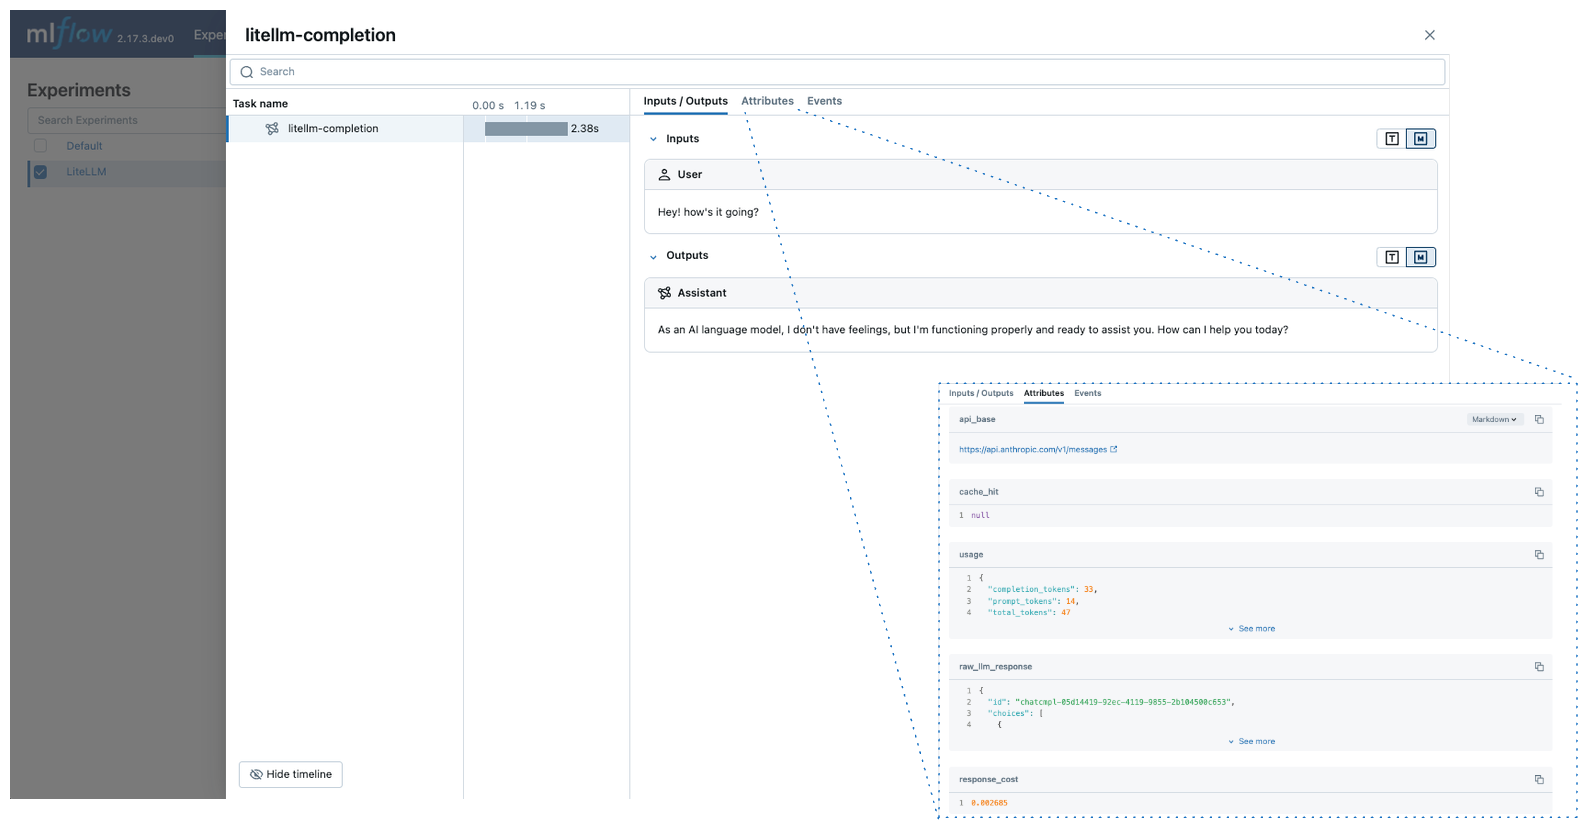
MLflow Tracing provides automatic tracing capability for LiteLLM. By enabling auto tracing
for LiteLLM by calling the mlflow.litellm.autolog() function, MLflow will capture traces for LLM invocation and log them to the active MLflow Experiment.
MLflow trace automatically captures the following information about LiteLLM calls:
- Prompts and completion responses
- Latencies
- Metadata about the LLM provider, such as model name and endpoint URL
- Token usages and cost
- Cache hit
- Any exception if raised
Getting Started
Install Dependencies
pip install 'mlflow[genai]' litellm
Start MLflow Server
- Local (pip)
- Local (docker)
If you have a local Python environment >= 3.10, you can start the MLflow server locally using the mlflow CLI command.
mlflow server
MLflow also provides a Docker Compose file to start a local MLflow server with a postgres database and a minio server.
git clone --depth 1 --filter=blob:none --sparse https://github.com/mlflow/mlflow.git
cd mlflow
git sparse-checkout set docker-compose
cd docker-compose
cp .env.dev.example .env
docker compose up -d
Refer to the instruction for more details, e.g., overriding the default environment variables.
Enable Tracing and Make API Calls
Enable tracing with mlflow.litellm.autolog() and make API calls as usual.
import mlflow
import litellm
import os

# Enable auto-tracing for LiteLLM
mlflow.litellm.autolog()

# Set a tracking URI and an experiment
mlflow.set_tracking_uri("http://localhost:5000")
mlflow.set_experiment("LiteLLM")

# Set your API keys (LiteLLM will use them automatically)
os.environ["ANTHROPIC_API_KEY"] = "your-anthropic-key"  # Example for Anthropic

# Call Anthropic API via LiteLLM
response = litellm.completion(
    model="claude-3-5-sonnet-20240620",
    messages=[{"role": "user", "content": "Hey! how's it going?"}],
)
View Traces in MLflow UI
Browse to the MLflow UI at http://localhost:5000 (or your MLflow server URL) and you should see the traces for the LiteLLM API calls.
Supported APIs
LiteLLM supports 100+ LLM providers through a unified interface. MLflow automatically traces all supported providers.
| Normal | Streaming | Async |
|---|---|---|
| ✅ | ✅ | ✅ |
Examples
Basic Example
import mlflow
import litellm
import os

# Enable auto-tracing for LiteLLM
mlflow.litellm.autolog()

# Optional: Set a tracking URI and an experiment
mlflow.set_tracking_uri("http://localhost:5000")
mlflow.set_experiment("LiteLLM")

# Call different providers via LiteLLM's unified interface
# Example with OpenAI
response = litellm.completion(
    model="gpt-4o-mini",
    messages=[{"role": "user", "content": "Hello from LiteLLM!"}],
)

# Example with Anthropic
response = litellm.completion(
    model="claude-3-5-sonnet-20240620",
    messages=[{"role": "user", "content": "Hey! how's it going?"}],
)
Async API
MLflow supports tracing LiteLLM's async APIs:
mlflow.litellm.autolog()

response = await litellm.acompletion(
    model="claude-3-5-sonnet-20240620",
    messages=[{"role": "user", "content": "Hey! how's it going?"}],
)
Streaming
MLflow supports tracing LiteLLM's sync and async streaming APIs:
mlflow.litellm.autolog()

response = litellm.completion(
    model="claude-3-5-sonnet-20240620",
    messages=[{"role": "user", "content": "Hey! how's it going?"}],
    stream=True,
)
for chunk in response:
    print(chunk.choices[0].delta.content, end="|")
MLflow will record concatenated outputs from the stream chunks as a span output.
Disable auto-tracing
Auto tracing for LiteLLM can be disabled globally by calling mlflow.litellm.autolog(disable=True) or mlflow.autolog(disable=True).