Tracing OpenHands
MLflow Tracing provides automatic tracing for OpenHands, a leading open-source AI agent framework for autonomous software development. OpenHands agents interact with code, terminals, file systems, and the web, and support multiple LLM providers including Claude, OpenAI, and open-source models.
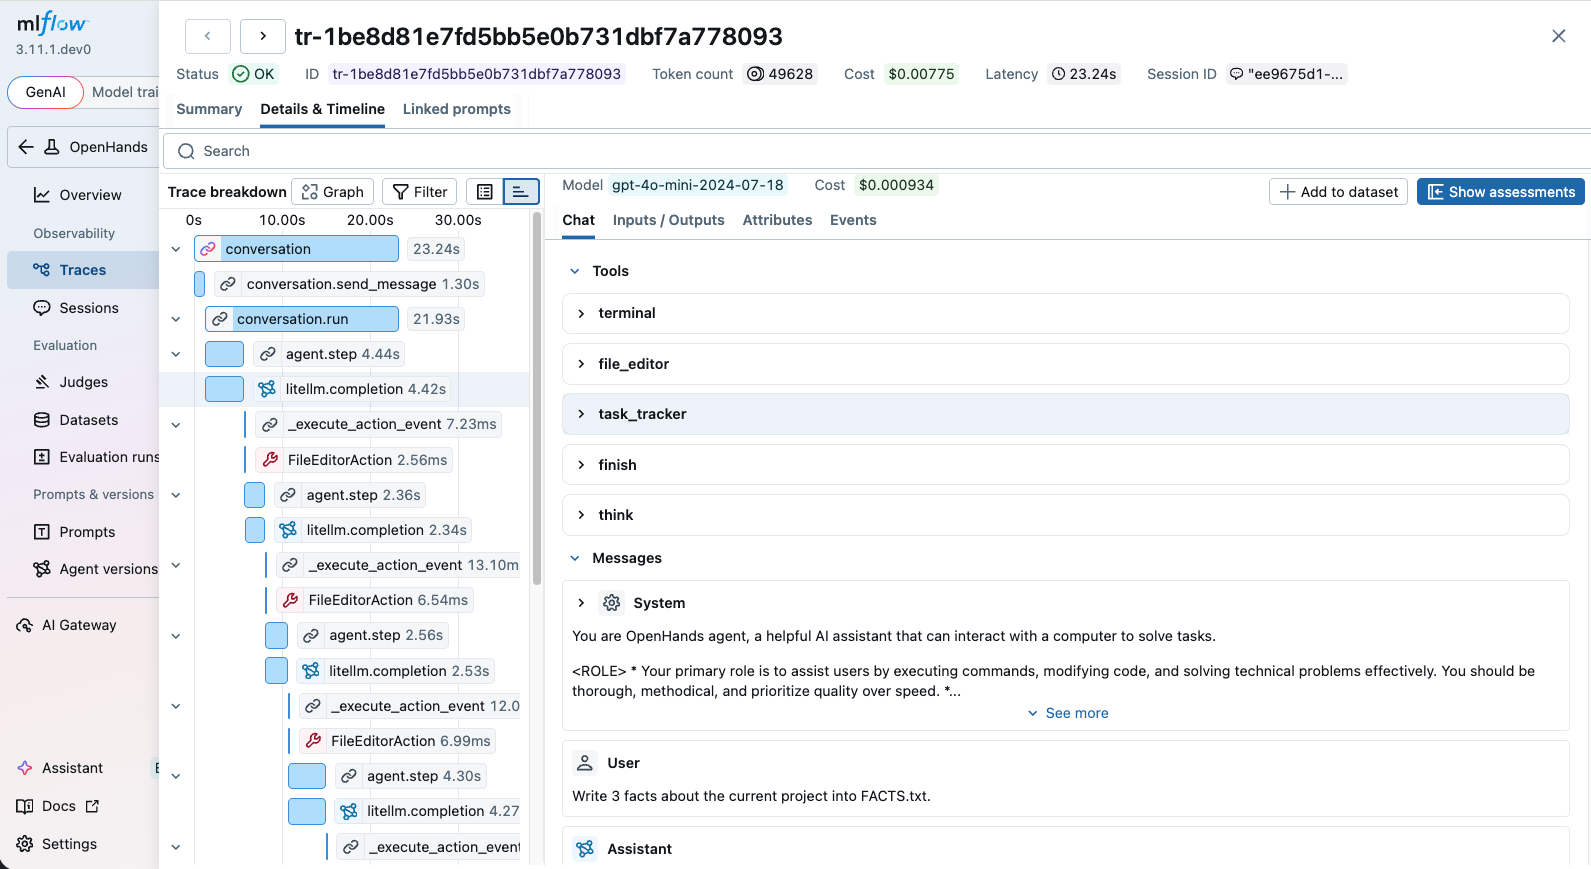
OpenHands emits OpenTelemetry traces natively, and MLflow accepts them out of the box. Whether you use OpenHands through the SDK or the CLI, after setting up the connection, MLflow will automatically capture traces of your OpenHands agent runs. The trace automatically captures information such as:
- User prompts and assistant responses
- Tool usage (terminal commands, file editing, web browsing, etc.)
- The tools and system prompt given to the agent
- Latency of each step
- Token usage breakdown and corresponding costs
Setup
OpenHands tracing is configured using OpenTelemetry environment variables that point to your MLflow server. Select the SDK or CLI tab below depending on how you use OpenHands.
Install OpenHands
Install the OpenHands SDK or CLI.
- SDK
- CLI
pip install openhands-sdk
uv tool install openhands --python 3.12
Start MLflow Server
Start an MLflow server if you haven't already. This step is common to both the SDK and CLI.
mlflow server
Or using Docker Compose:
docker compose up -d
Set Environment Variables
- SDK
- CLI
Set the following environment variables to connect OpenHands traces to your MLflow server:
import os

# Point OpenTelemetry traces to your MLflow server
os.environ["OTEL_EXPORTER_OTLP_ENDPOINT"] = "http://localhost:5000"
os.environ["OTEL_EXPORTER_OTLP_HEADERS"] = (
    "x-mlflow-experiment-id=123"  # Replace "123" with your MLflow experiment ID
)
os.environ["OTEL_EXPORTER_OTLP_TRACES_PROTOCOL"] = "http/protobuf"
Set the following environment variables before running the CLI:
export OTEL_EXPORTER_OTLP_ENDPOINT="http://localhost:5000"
export OTEL_EXPORTER_OTLP_HEADERS="x-mlflow-experiment-id=123"  # Replace "123" with your MLflow experiment ID
export OTEL_EXPORTER_OTLP_TRACES_PROTOCOL="http/protobuf"
Run OpenHands
- SDK
- CLI
With the environment variables set, run your OpenHands agent. Every LLM call, tool invocation, and agent step will be automatically traced.
from openhands.sdk import LLM, Agent, Conversation, Tool
from openhands.tools.file_editor import FileEditorTool
from openhands.tools.task_tracker import TaskTrackerTool
from openhands.tools.terminal import TerminalTool

llm = LLM("openai/gpt-5")

agent = Agent(
    llm=llm,
    tools=[
        Tool(name=TerminalTool.name),
        Tool(name=FileEditorTool.name),
        Tool(name=TaskTrackerTool.name),
    ],
)

cwd = os.getcwd()
conversation = Conversation(agent=agent, workspace=cwd)

conversation.send_message("Write 3 facts about the current project into FACTS.txt.")
conversation.run()
print("All done!")
With the environment variables set, run OpenHands from the command line. Every LLM call, tool invocation, and agent step will be automatically traced.
openhands -t "Write 3 facts about the current project into FACTS.txt."
Once the agent finishes, navigate to the MLflow UI (e.g. http://localhost:5000), select the experiment, and open the "Traces" tab to view the recorded traces.
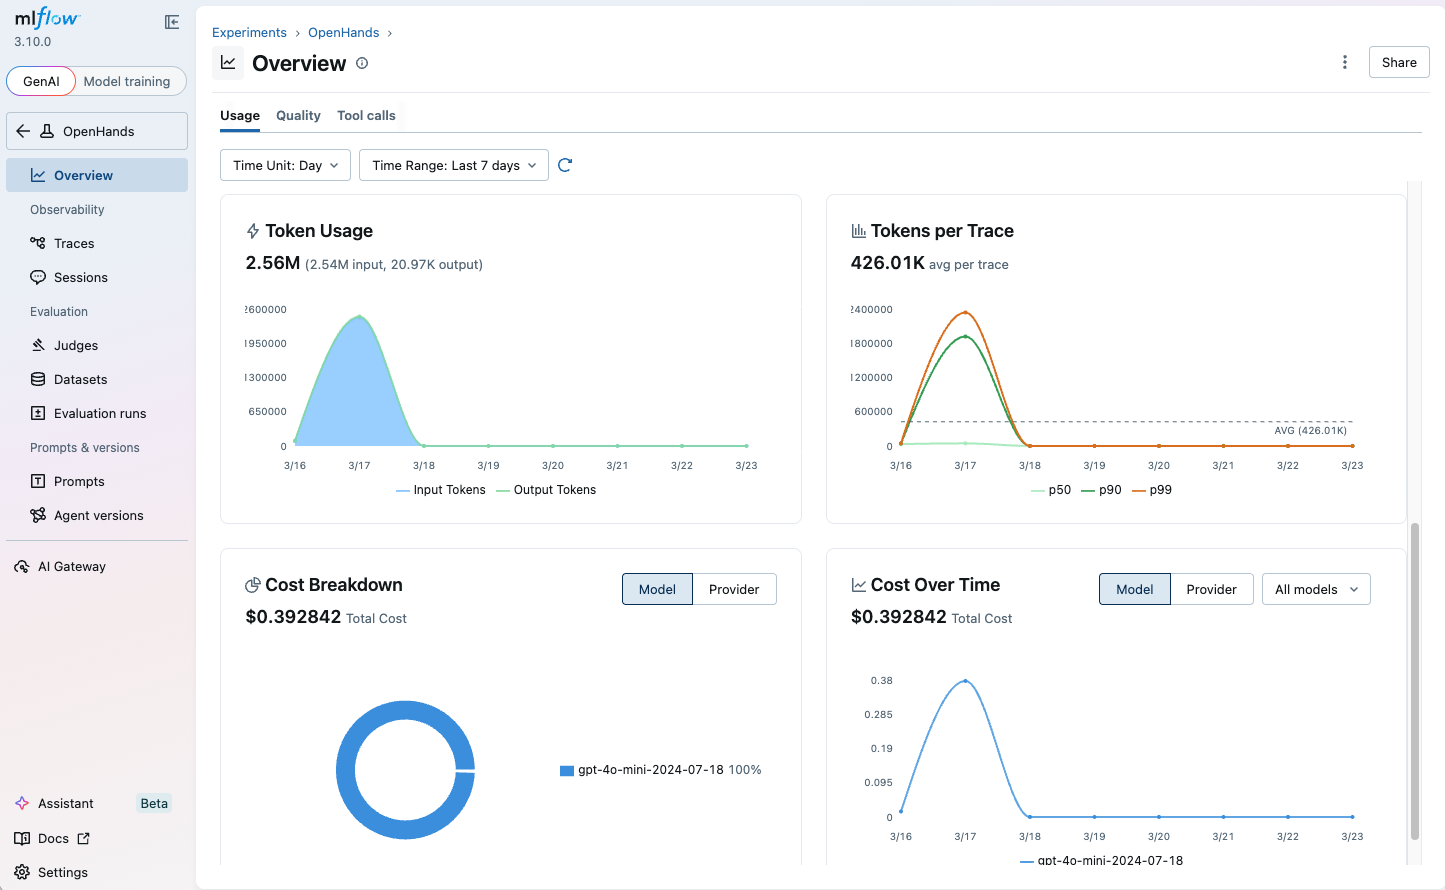
Monitoring Token Usage
MLflow automatically tracks token usage for each LLM call within OpenHands agent runs. The token usage and cost will be displayed in the Overview dashboard and the trace detail page.
AI Gateway provides centralized governance for all LLM traffic from OpenHands, including budget control, usage tracking, and secret management.
To route OpenHands LLM calls through MLflow AI Gateway, set the base_url to the AI Gateway endpoint URL:
llm = LLM(
    base_url="http://localhost:5000/gateway/mlflow/v1",  # MLflow AI Gateway endpoint URL
    model="my-openai-endpoint",  # Name of the endpoint configured in AI Gateway
)
This gives you:
- Budget control - set budget policies to alert or reject when spending exceeds a threshold
- Usage tracking - every LLM call is logged with token-level cost visibility
- Secret management - store API keys securely in the gateway instead of your scripts
- Fallback routing - define fallback chains for provider availability
Next Steps
Track User Feedback
Record user feedback on traces for tracking user satisfaction.
Manage Prompts
Learn how to manage prompts with MLflow's prompt registry.
Evaluate Traces
Evaluate traces with LLM judges to understand and improve your AI application's behavior.