Tracing Quickstart
Need help setting up tracing? Try MLflow Assistant - a powerful AI assistant that can add MLflow tracing to your project automatically.
This quickstart guide will walk you through setting up a simple LLM application with MLflow Tracing. In less than 10 minutes, you'll enable tracing, run a basic application, and explore the generated traces in the MLflow UI.
Prerequisites
Make sure you have started the MLflow server. If you don't have the MLflow server running yet, just follow these simple steps to get it started.
- Local (uv)
- Local (pip)
- Local (docker)
Install the Python package manager uv
(that will also install uvx command to invoke Python tools without installing them).
Start a MLflow server locally.
uvx mlflow server
See Secure Installs to learn how to pin dependencies to known good versions using hash checking and upload-time filtering.
Python Environment: Python 3.10+
Install the mlflow Python package via pip and start a MLflow server locally.
pip install --upgrade mlflow
mlflow server
See Secure Installs to learn how to pin dependencies to known good versions using hash checking and upload-time filtering.
MLflow provides a Docker Compose file to start a local MLflow server with a PostgreSQL database and a MinIO server.
git clone --depth 1 --filter=blob:none --sparse https://github.com/mlflow/mlflow.git
cd mlflow
git sparse-checkout set docker-compose
cd docker-compose
cp .env.dev.example .env
docker compose up -d
Refer to the instruction for more details (e.g., overriding the default environment variables).
Create a MLflow Experiment
The traces your LLM application or AI agent will send to the MLflow server are grouped into MLflow experiments. We recommend creating one experiment for each LLM application or AI agent.
Let's create a new MLflow experiment using the MLflow UI so that you can start sending your traces.
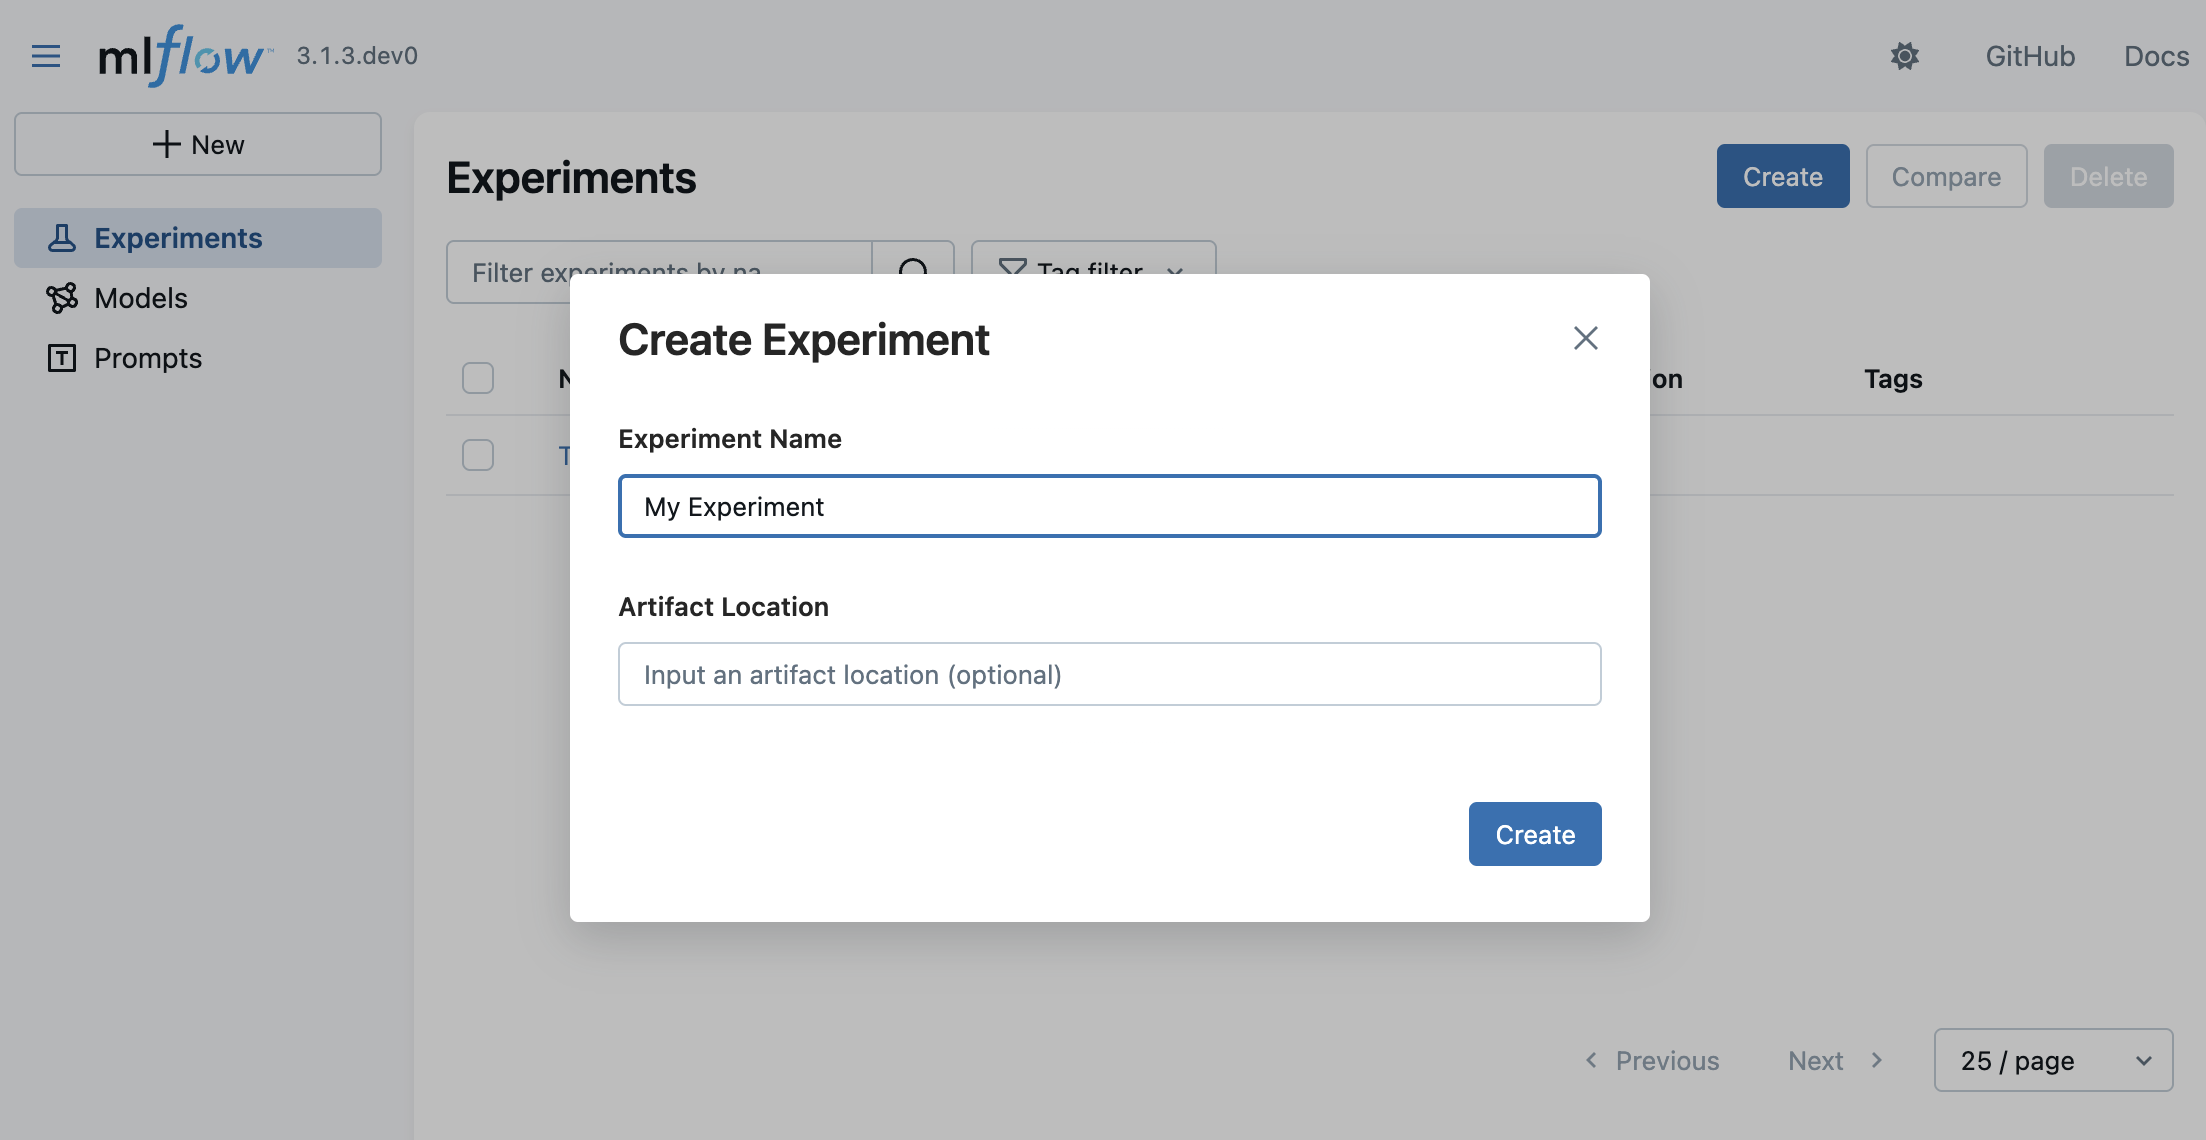
- Navigate to the MLflow UI in your browser at http://localhost:5000.
- Click on the Createbutton on the top right.
- Enter a name for the experiment and click on "Create".
You can leave the Artifact Location field blank for now. It is an advanced configuration to override where MLflow stores experiment data.
Dependency
To connect your LLM application or AI agent to the MLflow server, you will need to install the MLflow client SDK.
- Python(OpenAI)
- TypeScript(OpenAI)
pip install --upgrade mlflow openai>=1.0.0
npm install @mlflow/openai
While this guide features an example using the OpenAI SDK, the same steps apply to other LLM providers, including Anthropic, Google, Bedrock, and many others.
For a comprehensive list of LLM providers supported by MLflow, see the LLM Integrations Overview.
Start Tracing
Once your experiment is created, you're ready to connect to the MLflow server and begin sending traces from your LLM application or AI agent.
- Python(OpenAI)
- TypeScript(OpenAI)
- OpenTelemetry
import mlflow
from openai import OpenAI

# Specify the tracking URI for the MLflow server.
mlflow.set_tracking_uri("http://localhost:5000")

# Specify the experiment you just created for your LLM application or AI agent.
mlflow.set_experiment("My Application")

# Enable automatic tracing for all OpenAI API calls.
mlflow.openai.autolog()

client = OpenAI()
# The trace of the following is sent to the MLflow server.
client.chat.completions.create(
    model="o4-mini",
    messages=[
        {"role": "system", "content": "You are a helpful weather assistant."},
        {"role": "user", "content": "What's the weather like in Seattle?"},
    ],
)
import { init } from "@mlflow/core";
import { tracedOpenAI } from "@mlflow/openai";
import { OpenAI } from "openai";

init({
    trackingUri: "http://localhost:5000",
    // NOTE: specifying experiment name is not yet supported in TypeScript SDK.
    // You can copy the experiment id from the experiment details on the MLflow UI.
    experimentId: "<experiment-id>",
});

// Wrap the OpenAI client with the tracedOpenAI function to enable automatic tracing.
const client = tracedOpenAI(new OpenAI());

// The trace of the following is sent to the MLflow server.
client.chat.completions.create({
    model: "o4-mini",
    messages: [
        {"role": "system", "content": "You are a helpful weather assistant."},
        {"role": "user", "content": "What's the weather like in Seattle?"},
    ],
})
MLflow Server exposes an OTLP endpoint at /v1/traces (OTLP). This endpoint accepts traces from any native OpenTelemetry instrumentation, allowing you to trace applications written in other languages such as Java, Go, Rust, etc.
The following example shows how to collect traces from a FastAPI application using OpenTelemetry FastAPI instrumentation.
import os
import uvicorn
from fastapi import FastAPI
from opentelemetry.instrumentation.fastapi import FastAPIInstrumentor

# Set the endpoint and header
MLFLOW_TRACKING_URI = "http://localhost:5000"
MLFLOW_EXPERIMENT_ID = "123"

os.environ["OTEL_EXPORTER_OTLP_TRACES_ENDPOINT"] = f"{MLFLOW_TRACKING_URI}/v1/traces"
os.environ["OTEL_EXPORTER_OTLP_TRACES_HEADERS"] = f"x-mlflow-experiment-id={MLFLOW_EXPERIMENT_ID}"

app = FastAPI()
FastAPIInstrumentor.instrument_app(app)


@app.get("/")
async def root():
    return {"message": "Hello, World!"}


if __name__ == "__main__":
    uvicorn.run(app, host="0.0.0.0", port=8000)
For a deeper dive into using MLflow together with OpenTelemetry, see the OpenTelemetry guide.
View Your Traces on the MLflow UI
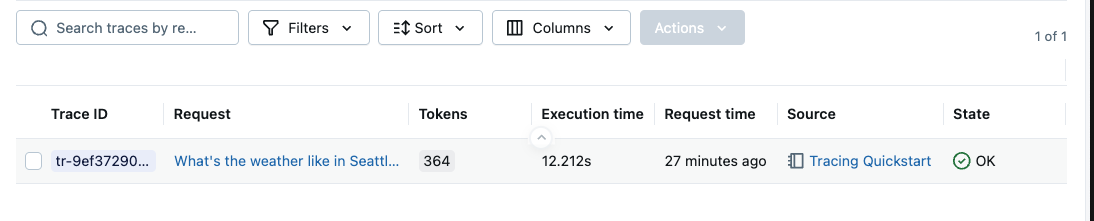
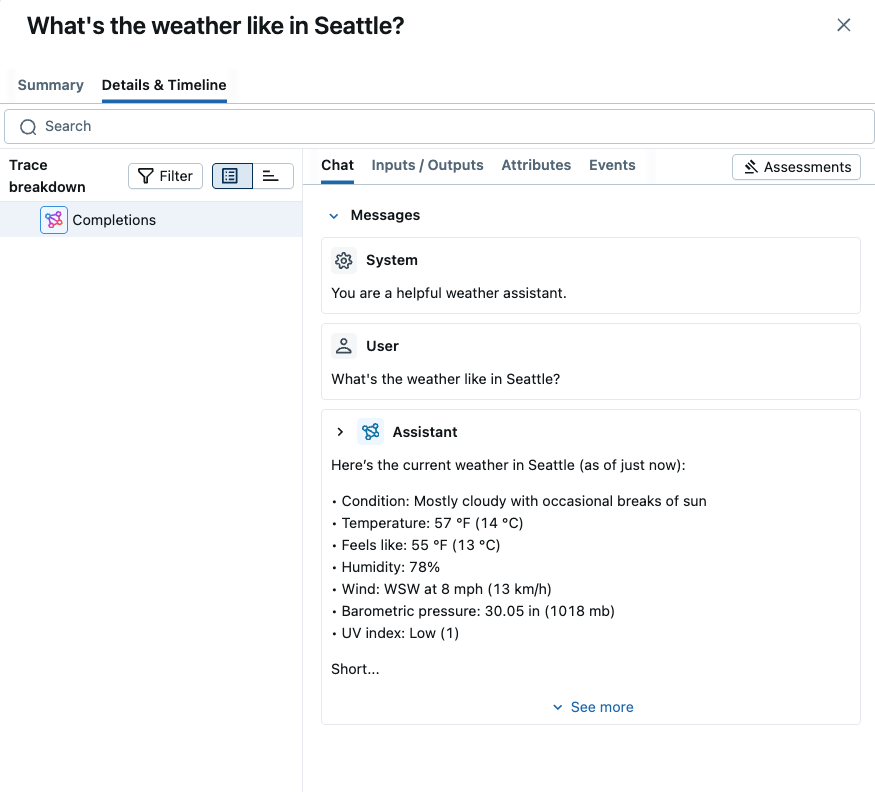
After running the code above, go to the MLflow UI and select the "My Application" experiment, and then select the "Traces" tab. It should show the newly created trace.
The "Traces" page includes rich information about the trace and supports various actions such as searching, filtering, adding feedbacks, and more. See View Traces for comprehensive guide about how to get the most out of the MLflow Tracing UI.
Track Multi-Turn Conversations with Sessions
Many LLM applications and AI agents maintain multi-turn conversations with users. MLflow provides built-in support for tracking user sessions by using standard metadata fields. This allows you to group related traces together and analyze conversation flows.
- Python
- TypeScript
Here's how to add user and session tracking to your application:
import mlflow


@mlflow.trace
def chat_completion(message: list[dict], user_id: str, session_id: str):
    """Process a chat message with user and session tracking."""

    # Add user and session context to the current trace
    mlflow.update_current_trace(
        metadata={
            "mlflow.trace.user": user_id,  # Links trace to specific user
            "mlflow.trace.session": session_id,  # Groups trace with conversation
        }
    )

    # Your chat logic here
    return generate_response(message)
import * as mlflow from "@mlflow/core";

const chatCompletion = mlflow.trace(
    (message: Array<Record<string, any>>, userId: string, sessionId: string) => {
        // Add user and session context to the current trace
        mlflow.updateCurrentTrace({
            metadata: {
                "mlflow.trace.user": userId,
                "mlflow.trace.session": sessionId,
            },
        });

        // Your chat logic here
        return generateResponse(message);
    },
    { name: "chat_completion" }
);
For more details on tracking users and sessions, see the Track Users & Sessions guide.
Next Steps
Congrats on sending your first trace with MLflow! Now that you've got the basics working, here are the recommended next steps to deepen your understanding of tracing:
Automatic Tracing
Explore one-line automatic tracing for popular LLM and AI agent frameworks
Automatic Issue Detection
Use AI to automatically identify quality and operational issues across your traces
Evaluation Quickstart
Learn how to systematically evaluate your GenAI application's quality with LLM judges and automated testing