LLM Tracing and AI Tracing
LLM tracing is the practice of capturing detailed execution data for every large language model call in your application, including prompts, completions, model parameters, token counts, latency, and metadata. When tracing extends beyond individual LLM calls to cover entire AI system stacks (embeddings, retrievers, RAG pipelines), this is known as AI tracing. For multi-step autonomous agents, tracing the complete decision-making process is known as agent tracing.
LLM tracing is a foundational component of AI observability. While observability encompasses tracing, evaluation, monitoring, and feedback collection, tracing provides the raw execution data that makes all other observability capabilities possible. LLM tracing gives engineering teams deep visibility into what their AI applications are actually doing: not just whether they're running, but what prompts are being sent, what responses are being generated, how much they're costing, and where failures occur. As LLM applications move from prototypes to production-critical systems, tracing becomes essential for debugging, optimization, and quality assurance.
Unlike traditional logging, LLM tracing captures the full context of AI execution in a structured, queryable format. It records prompts, model responses, tool calls, retrieval results, token usage, and nested spans showing multi-step reasoning. This structured telemetry allows teams to search for patterns (e.g., "all traces where token usage exceeded 10,000"), debug specific failures, and understand the "why" behind every output.
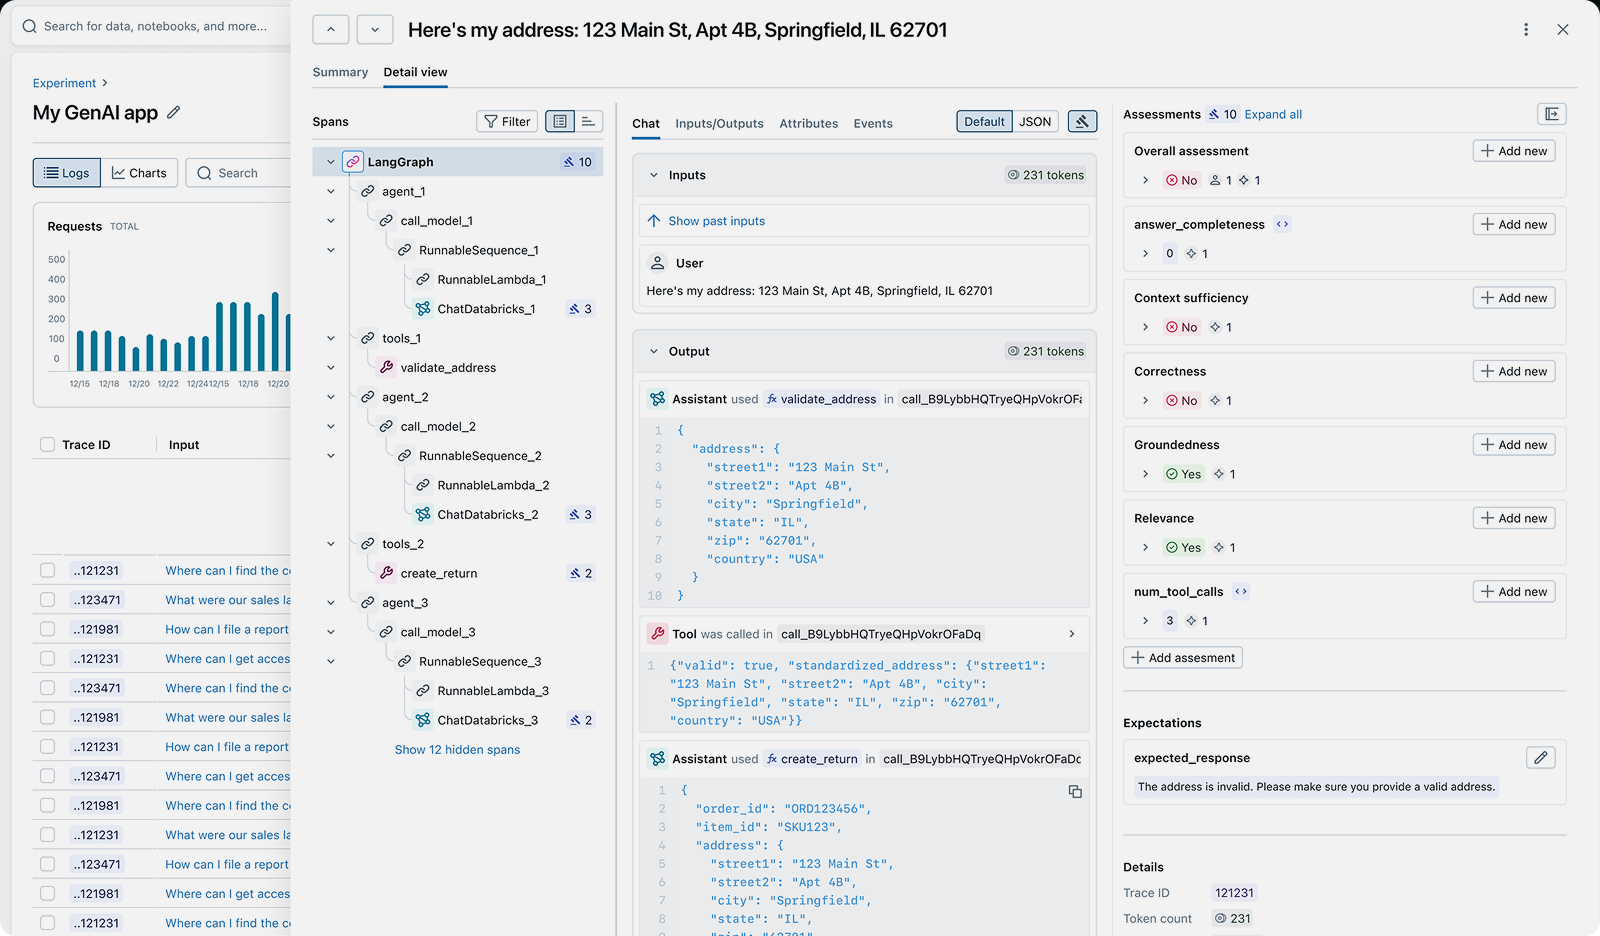
An LLM trace showing prompts, completions, token usage, latency, and execution metadata
Quick Navigation:
Why LLM Tracing Matters
LLM applications introduce unique challenges that traditional logging can't address:
Debugging Non-Determinism
Problem: LLMs produce different outputs for the same input. Traditional logs can't capture the full context needed to debug why a specific output was generated.
Solution: Tracing captures prompts, model parameters, and responses together, making every execution reproducible and debuggable.
Cost Optimization
Problem: Token costs can spiral without visibility into which requests are most expensive and why.
Solution: Track token usage per request, identify inefficient prompts, and find opportunities to switch to smaller models without sacrificing quality.
Quality Assurance
Problem: LLMs can produce hallucinations, irrelevant responses, or degraded outputs that undermine user trust.
Solution: Trace data combined with automated evaluation helps detect quality issues before they reach users.
Production Monitoring
Problem: Without tracing, it's impossible to know when LLM behavior changes due to model updates or prompt drift.
Solution: Continuous tracing provides a baseline for detecting regressions, latency spikes, and cost anomalies.
What is LLM Tracing?
LLM tracing captures detailed execution data for every large language model call in your application. Each trace records:
- Prompts: The exact input sent to the model, including system messages, user messages, and few-shot examples.
- Completions: The full response generated by the model, including all candidate outputs if using n > 1.
- Model Parameters: Temperature, top_p, max_tokens, stop sequences, and other configuration that influences output.
- Token Usage: Prompt tokens, completion tokens, and total tokens consumed, enabling cost tracking.
- Latency: Time to first token, total response time, and server-side processing time.
- Metadata: User IDs, session IDs, request IDs, and custom tags for filtering and analysis.
This structured data allows teams to search for patterns (e.g., "all traces where latency exceeded 5 seconds"), debug specific failures, and understand cost drivers. Unlike logs, traces are designed to be queried, aggregated, and correlated across millions of requests.
MLflow's automatic tracing captures all of this telemetry with a single line of code for 50+ LLM providers and frameworks, storing traces locally or sending them to your tracking server for analysis and monitoring.
What is AI Tracing?
AI tracing extends LLM tracing to cover the entire AI application stack, not just individual model calls. While LLM tracing focuses on capturing prompts and completions, AI tracing captures every component of your AI system:
- Embeddings: Text chunks embedded, embedding models used, vector dimensions, and computation time.
- Retrievers: Search queries, retrieved documents, similarity scores, and retrieval latency.
- RAG Pipelines: Document chunking, retrieval, re-ranking, and context assembly steps.
- Multi-Model Systems: Chains of different models (e.g., embedding model → ranking model → generation model).
- Custom Logic: Business logic, data transformations, and external API calls integrated with LLMs.
AI tracing captures these components as a single execution graph, showing how data flows through your entire AI stack. This makes it possible to debug failures that span multiple components (e.g., "the retriever returned irrelevant documents, so the LLM hallucinated") and optimize end-to-end latency and cost.
With MLflow's OpenTelemetry-compatible tracing, you can trace any component of your AI stack, not just LLM calls. Use @mlflow.trace decorators to instrument custom functions, or rely on automatic tracing for popular frameworks like LangChain, LlamaIndex, and LangGraph.
What is Agent Tracing?
Agent tracing extends AI tracing to multi-step autonomous agents. While LLM tracing tracks individual model calls and AI tracing captures multi-component pipelines, agent tracing reveals the complete decision-making process of agents that reason, plan, and act across multiple turns.
Agents built with frameworks like LangGraph, CrewAI, or AutoGen make dynamic decisions: which tools to call, when to retry, how to recover from errors, and when to ask for help. Agent tracing captures this execution graph:
- Reasoning Steps: Internal thoughts, planning, and reflection that guide the agent's actions.
- Tool Calls: Which tools were invoked, with what arguments, and what they returned.
- Conditional Branches: How the agent chose between different paths based on intermediate results.
- Iterative Loops: Retry logic, error handling, and multi-turn interactions with tools or users.
- Parallel Execution: Simultaneous tool calls and how results are merged.
This visibility is critical for debugging agent failures. When an agent gets stuck in a loop, makes incorrect tool choices, or produces unexpected outputs, agent tracing shows exactly where the reasoning went wrong.
MLflow automatically traces agent workflows, capturing the full directed acyclic graph (DAG) of execution. You can see every reasoning step, tool call, and decision point, making it easy to identify and fix problematic agent behaviors.
Common Use Cases for LLM Tracing
LLM tracing solves real-world problems across the AI lifecycle:
- Debugging Hallucinations: When your LLM produces incorrect outputs, tracing shows exactly what prompt was sent, what context was included, and what parameters were used. This makes it easy to identify whether the problem is in prompt construction, retrieval quality, or model behavior.
- Optimizing Token Costs: Track token usage and costs per request to identify expensive queries, inefficient prompts, or opportunities to switch to smaller models. Teams use tracing to reduce LLM costs by 30-50% without sacrificing quality.
- Monitoring Production Quality: Continuous tracing combined with automated evaluation helps detect when model behavior degrades from API updates, prompt drift, or data changes—before users notice.
- A/B Testing Prompts: Before deploying prompt changes to production, use traced data to run side-by-side evaluations. Compare quality metrics like relevance, factuality, and safety to ensure changes improve output quality.
- Understanding Agent Behavior: Agents can behave unpredictably—getting stuck in loops, making incorrect tool choices, or producing inconsistent outputs. Agent tracing shows every reasoning step, tool call, and decision point so you can identify and fix problematic patterns.
- Compliance & Auditing: Capture complete audit trails showing what prompts were sent, what responses were received, and what data was accessed. Enforce PII redaction policies and content guardrails to meet regulatory requirements.
How to Implement LLM Tracing
Modern open-source AI platforms like MLflow make it easy to add production-grade LLM tracing with minimal code changes.
With just a single line of code, you can automatically capture traces for every LLM call, including prompts, responses, token usage, latency, and model parameters. These traces are stored locally or sent to your MLflow tracking server, where you can search, filter, and analyze them in the MLflow UI.
Here are quick examples of enabling automatic tracing. Check out the MLflow tracing integrations documentation to see how to use tracing with LangChain, LangGraph, LlamaIndex, Vercel AI SDK, and other frameworks.
OpenAI
import mlflow# Enable automatic tracing for OpenAImlflow.openai.autolog()# That's it - every LLM call is now tracedfrom openai import OpenAIclient = OpenAI()response = client.chat.completions.create(model="gpt-5.2",messages=[{"role": "user", "content": "Hello!"}],)
LangGraph
import mlflow# Enable automatic tracing for LangChainmlflow.langchain.autolog()from langchain_openai import ChatOpenAIfrom langchain.agents import initialize_agent, AgentTypellm = ChatOpenAI(model="gpt-5.2")agent = initialize_agent(tools, llm, agent=AgentType.ZERO_SHOT_REACT_DESCRIPTION)agent.run("What is the weather in San Francisco?")
Vercel AI SDK
import { generateText } from 'ai';import { openai } from '@ai-sdk/openai';// Configure OpenTelemetry to send traces to MLflow// (see MLflow docs for setup details)// Enable tracing for each AI SDK callconst result = await generateText({model: openai('gpt-5.2'),prompt: 'What is MLflow?',experimental_telemetry: { isEnabled: true }});
The MLflow UI automatically captures and displays traces for every LLM call
MLflow is the largest open-source AI platform, backed by the Linux Foundation and licensed under Apache 2.0. With 20,000+ GitHub stars and 900+ contributors, it provides complete LLM tracing with no vendor lock-in. Get started →
Open Source vs. Proprietary LLM Tracing
When choosing an LLM tracing platform, the decision between open source and proprietary SaaS tools has significant long-term implications for your team, infrastructure, and data ownership.
Open Source (MLflow): With MLflow, you maintain complete control over your tracing infrastructure and data. Deploy on your own infrastructure or use managed versions on Databricks, AWS, or other platforms. There are no per-trace fees, no usage limits, and no vendor lock-in. Your trace data stays under your control, and you can customize the platform to your exact needs. MLflow integrates with any LLM provider and agent framework through OpenTelemetry-compatible tracing.
Proprietary SaaS Tools: Commercial tracing platforms offer convenience but at the cost of flexibility and control. They typically charge per trace volume or per seat, which can become expensive at scale. Your data is sent to their servers, raising privacy and compliance concerns. You're locked into their ecosystem, making it difficult to switch providers or customize functionality. Most proprietary tools only support a subset of LLM providers and frameworks.
Why Teams Choose Open Source: Organizations building production LLM applications increasingly choose MLflow because it offers enterprise-grade tracing without compromising on data sovereignty, cost predictability, or flexibility. The Apache 2.0 license and Linux Foundation backing ensure MLflow remains truly open and community-driven, not controlled by a single vendor.